Team No Comments

Are Cash ISA savers holding too much cash?

Please see below for one of AJ Bell Youinvest’s latest Investment Insight articles, received by us yesterday 21/03/2021:

New consumer research* by Opinium for AJ Bell shows Cash ISA savers are holding high levels of cash, and aren’t switching accounts looking for better rates, partly because they think they’re getting more interest than they probably are.

We know that since the start of the pandemic, many savers have been all cashed up with nowhere to go. But our research shows that cash hoarding isn’t just a recent phenomenon, it’s been happening for some time, and reflects a natural aversion to taking risk with money that has been hard-earned.

It’s definitely prudent to build up a cash buffer to deal with any unexpected costs, particularly in uncertain times. But Cash ISA savers may well be doing themselves a disservice by holding too much money in cash, opening themselves up to inflation risk, and missing out on the potentially higher returns available from investments. As stock market investors need to avoid irrational exuberance, so cash savers should be wary of excessive prudence.

Over the last ten years, the average Cash ISA has turned £10,000 into £9,770 after factoring in inflation, while in contrast, an investment in the global stock market has turned £10,000 into £20,760 in real terms.** Looking at returns from 1899, Barclays found that over ten years, UK equities have beaten cash 91% of the time. Given that today cash interest rates are at record lows, it would have to be an extremely anomalous decade for the next ten years to buck that trend.

Cash ISA savers aren’t shopping around for the best rate a great deal either. Much of their apathy can be attributed to ultra-low interest rates, but part of it may simply be that they haven’t checked the rate they’re getting. Our survey found that on average Cash ISA holders hadn’t reviewed their rate for two and a half years, over which time the average Cash ISA interest rate has more than halved, from 0.9% to 0.4%.

Not all rates move in step though, and individual savers can suffer as a result of their provider slashing rates more aggressively than the rest of the market, hence why it continues to make sense to shop around. For instance, last November, savers in NS&I’s Direct ISA saw their interest rate cut from 0.9% to 0.1%, while the best rates on the market are around 0.5%.

Even the top rates on offer aren’t exactly going to set pulses racing, but switching can mean hundreds of pounds extra for those with large amounts held in Cash ISAs. At the very least Cash ISA savers should find out what rate they’re getting right now, to make an informed decision on whether it’s worth moving on.

All cashed up and nowhere to go

Our survey shows Cash ISA savers reported holding on average £27,727 in their accounts. That’s enough to pay for 11 months of household expenses, which come in at £2,538 on average according to the ONS.*** When you consider that many households will contain two Cash ISA holders, and may also own other cash products like savings accounts and Premium Bonds, that suggests that savers have enough built up to deal with any emergency spending, and then some. On top of that, 6 out of 10 (59%) or respondents said they intended to add more to their Cash ISA in this tax year or next, no doubt in part thanks to the pandemic savings turbo-charging cash balances, as spending options have dried up.

While this is encouraging from the point of view of short term financial security, it does mean savers are sitting on cash for the long run, missing out on potential returns from other assets, and seeing the buying power of their cash eroded by inflation. Clearly there is a balance to be struck here between having a robust safety net, and seeking higher returns by investing in the stock market, which can lead to a loss of capital in the short term. Typically, savers should seek to have 3 to 6 months of expenses in cash to deal with any emergencies, beyond that they should seek to tilt the balance between security and return more towards the latter.

Three to six months of expenses equates to £7,613 to £15,226 for the average household, which may well have two Cash ISA savers in it. This broadly ties in with the view expressed by the FCA in December, that those with more than £10,000 held solely in cash were missing out on the historically higher returns from investing their money, and opening themselves up to inflation risk.****

There are some reasons why you might want to hold more than six months of expenses in an ISA, namely if you are saving for a specific goal, for instance a house deposit. This probably explains a surprising kink in the data, which shows that younger savers actually have more held in Cash ISAs than older generations.

Broadly speaking, if you think you may need access to your money within five years, then cash might be the best option. If you’re putting money away for five to ten years, then you should start to think about putting at least some of it in the stock market. If you’re putting cash away for more than ten years, then an approach that invests more heavily in the stock market is likely to yield significantly better results.

Cash ISA inertia

Cash ISA savers aren’t paying a great deal of attention to the rate they’re getting, and who can blame them, seeing as picking cash products right now is about selecting the least worst option. Our survey found that on average Cash ISA holders hadn’t reviewed their rate for two and a half years, over which time the average Cash ISA interest rate has more than halved, from 0.9% to 0.4%, according to Bank of England data. Worryingly, almost a quarter of Cash ISA savers (23%) said they hadn’t reviewed their cash ISA rate for 5 years or more. This goes some way to explaining why 25% of Cash ISA savers reported getting over 1% interest, which looks unrealistically high in today’s market.

Despite holding a Cash ISA for an average of 8.5 years, 45% of Cash ISA savers said they have never switched provider. Half of these savers said it was because rates were so low, it didn’t seem worth it. That’s perfectly understandable, though for those with large sums in Cash ISAs offering poor rates, the difference can still be significant.

20% of Cash ISA savers said they held £50,000 or more in their Cash ISA. If they were picking up a high street rate of 0.1% (see table below) on £50,000, simply by moving to an account providing the average rate of 0.4% they could make an extra £150 a year. Not a king’s ransom, but worth having in your pocket rather than the bank’s. Particularly when you consider that at a rate of 0.1%, the total interest you are receiving is £50, and by moving to an account paying 0.4%, you would be quadrupling that amount to £200.

Selected high street instant access Cash ISA rates

Switching to a Stocks & Shares ISA

Half of Cash ISA savers surveyed (51%) said they had considered switching to a Stocks & Shares ISA. It used to be the case that you couldn’t cross the streams, but since 2014 you have been allowed transfer money from a Stocks and Shares ISA to a Cash ISA, and vice versa.

Doing so may be worthwhile if you feel you’ve got too much sitting in cash, earning next to nothing, and you’re willing to keep your money invested for the long term. You must be willing to tolerate falls in the value of your capital however, but the reward should be higher returns in the long run.

It’s important to always maintain a cash buffer for emergencies, three to six months of expenditure is the rough rule of thumb, but beyond this, you can start to think about investing in the market. Instead of transferring you might consider funnelling some of your new savings into a Stocks and Shares ISA, thereby gradually reducing your reliance on cash. Investing in the stock market bit by bit also helps to take the edge off the inevitable bumps in the road.

Please continue to utilise these blogs and expert insights to keep your own holistic view of the market up to date and for advice and planning tips.

Keep safe and well.

Paul Green DipFA

22/03/2021

Team No Comments

Lessons one year on from the low

As we reach the anniversary of the UK’s first national lockdown, please see below article received from AJ Bell yesterday, which reflects on how different parts of the market performed during the pandemic.

It was Warren Buffett’s mentor, Benjamin Graham, who once wrote: ‘The intelligent investor is a realist who sells to optimists and buys from pessimists.’ Such plain-speaking, common sense has yet again proved its worth over the past 12 months to offer a timely lesson to us all.

It is almost a year to the day (23 March 2020) since the FTSE 100 bottomed at 4,994 amid widespread fear over what the pandemic could do to global growth and corporate profits. 

A year later and the picture is very different. Anyone brave enough to have started to take on more risk a year ago would have done remarkably well, as four data sets show. Investors now must decide whether these trends will continue, further changes in performance trends since ‘Pfizer Monday’ on 9 November will dictate or that a further shift in gear is imminent.

GLOBAL ASSET CLASSES

Fear may have dominated a year ago, but equities have been the best place to be over the past 12 months. As benchmarked by the MSCI All World index, global stocks have beaten commodities and bonds. Government bonds, in theory a port in a storm, have provided no shelter with capital losses more than offsetting any yield that they offered.

There have been subtle changes since November. Commodities have taken the lead from equities and high yield bonds have started to flag. Meanwhile, the rout still seems to be on when it comes to investment-grade corporate and government bonds.

STOCK MARKETS

Unlike bonds, where all major categories have fallen on a one-year view, all geographic equities options have gained. Asia and Japan have performed consistently well, perhaps thanks to the relatively low number of pandemic cases they have suffered and their rapid, robust approach to test, track and trace as well as containment.

America’s domination of early 2020 has faded and it is prior laggards who have come to the fore – emerging markets and even the unloved UK equity market has put on a spurt, finding itself outpaced by just Eastern Europe and the Africa/Middle East region since November. This may be down to the perception that the UK is ahead of the game when it comes to vaccination programmes, having previously struggled to contain the virus.

EQUITY SECTORS

Technology continues to grab the headlines, especially as a raft of new initial public offerings tempts investors’ wallets. But miners, industrials and consumer discretionary stocks have all beaten tech over the past 12 months and oil has been the best performer of the lot, to reaffirm the adage that the darkest hour is before the dawn. 

Meanwhile, sectors that looked reliable going into a pandemic – utilities, consumer staples and even healthcare – have lagged, a trend that has become ever-more noticeable since the Pfizer-BioNTech announcement of last autumn.

UK STOCKS

These ‘big picture’ trends – a switch from defensives to turnaround plays, from ‘growth’ (and promises of long-term secular growth, or ‘jam tomorrow’, almost regardless of the economic backdrop) to ‘value’ (cyclicals that offer growth now, or ‘jam today,’ in the event of a recovery), from pandemic winners to bounce-back candidates can be seen on a bottom-up basis in how individual UK-quoted stocks have performed

That said, it has been hard to lose money since last year’s panic. Just nine of the FTSE 350’s current membership have lost ground over the last 12 months.

These trends have become even stronger since Pfizer Monday. Beneficiaries of an economic reopening dominate the leaderboard, notably travel and leisure stocks. The laggards include online delivery plays, precious metal miners, pharmaceutical plays and previously dependable names where investors may have paid too high a valuation, and thus mistaken reliability of earnings for safety of share price. Pay the wrong valuation and nothing is safe.

CONCLUSION

No-one will time a market bottom or top perfectly and trying is a mug’s game. But the trends of the past year show how investors can calibrate risk and earn rewards over time by going against the crowd, focusing on valuation and not getting carried away.

The best approach now could be to heed the words of another investment legend, Sir John Templeton: ‘Bull markets are born on pessimism, grow on scepticism, mature on optimism and die on euphoria.’ It is perhaps time to once more research those areas of which investors are frightened and tread carefully where fear of missing out predominates.

It will be interesting to see how markets and economies react to the easing of restrictions over the next few months. Please check in again with us soon.

Stay safe.

Chloe – 22/03/2021

Team No Comments

VW charges up for electric vehicle push

Please see the below article from AJ Bell received late yesterday afternoon:

German auto maker has grand plans for global EV market

In August 2020 we flagged German auto maker Volkswagen as a value play at €139, since when the stock has gained more than 40%.

Its shares have been particularly strong this year as the firm rolls out its electric vehicle strategy, culminating in this week’s ‘Power Day’.

In contrast, electric vehicle specialist Tesla has had a torrid time this year with shares tumbling from $900 in January to a 2021 low of $563.

VW has grand plans for a big electric vehicle push. As well as reducing the cost of ownership in the space it is investing heavily in new battery technology to improve range and in new charging networks to improve ease of use.

The company aims to reduce battery prices to below €100 per kilowatt hour through a combination of advanced cell design and lower manufacturing costs, all while using green energy.

Beginning with a €14 billion investment in Sweden with partner Northvolt, VW aims to have six gigafactories in Europe by 2030 with a combined capacity of 240 gigawatt hour.

More significantly, VW has partnered with BP, Spanish utility Iberdrola – a world leader in green energy – and Italian utility ENEL to install 18,000 new high-power charging stations across Europe.

The current lack of infrastructure is seen as a key reason for the slow mass adoption of electric vehicles. By working jointly to create a network of renewable-powered rapid-charging stations, each company gets closer to its net-zero goals to boot.

However, VW has even grander plans. All of its electric vehicles come with a home-charging station called Elli. When parked and connected to the Elli Cloud, a VW ID.3 becomes a ‘mobile power bank’ capable of feeding power back to the house for up to five days.

Using intelligent management systems, energy could be transferred to the vehicle during off-peak hours and transferred back to house when needed.

Not only would this save wasting renewable electricity – last year Germany wasted 6,000 gigawatt hours of renewable energy due to lack of storage – when rolled out to commercial and industrial customers it could drastically reduce the cost of expanding transmission networks.

Renewable energy is likely to be an area of rapid growth over the next few years. As the world navigates its way out of the Covid-19 pandemic, the world has been left with food for thought about how to make the planet better and how to sustain it. Companies around the world are adapting to renewable energy sources.

We regularly post a variety of ESG content, both our own and articles from a range of fund managers, and renewable energy is a key consideration in this (the E in ESG, E – Environmental).

This is definitely an area to watch!

Keep checking back for a range of blog content from us, from ESG outlooks, to market updates and insights, both our own original content and input from a wide range of fund managers and investment houses.

Andrew Lloyd

19/03/2021

Team No Comments

Jupiter Merlin Weekly: Cracks appearing in the central banks’ wall?

Please see below article received from Jupiter Asset Management yesterday afternoon, which comments on how major central banks are grappling with their reaction to rising bond yields, with the European Central Bank being the first to break ranks.

UK GDP shrank 2.9% in January, rather better than the 4.5%-5% contraction feared in the consensus estimate, bearing in mind not only the first full month of new Covid restrictions after Christmas but also the dislocation in the movement of imports and exports following Brexit on December 31st. The anecdotal ‘fast’ data, monitoring day-to-day consumer patterns (e.g., traffic congestion, credit card usage, electricity consumption etc) had suggested that Lockdown 3 would be less economically sensitive than its predecessors, and while a near 3% decline in normal circumstances would be a horror, it says much that it is a relative triumph of resilience when compared to the 20% economic decline recorded in April 2020.

Andrew Bailey, Governor of the Bank of England, still believes the economic outlook is good (the Bank’s “coiled spring”) but speaking at a symposium this week, he said that he would need to see evidence of prolonged excess inflation above 2% to require interest rates to be raised to cool any potential heat. In the meantime, he is still preparing the implementation of negative interest rates should the economy falter again. Among many mixed messages here, and despite markets’ scepticism reflected in higher bond yields (and therefore more expensive financing costs), he is effectively saying “I have all bases covered, and until anyone says otherwise, I propose to do nothing”.

The ECB, on the other hand, has broken ranks with the US Federal Reserve and the Bank of England and has responded to the challenge of rising bond yields (or more accurately, less negative yields in the case of Germany and Holland) and borrowing costs in the eurozone: it pledged to step up its QE programme with yet more incremental bond purchases on the simple premise that if demand exceeds supply, prices will rise and yields will fall. For the first time in two months eurozone yields have responded by moving in the opposite direction to their Anglo-Saxon counterparts.

The geopolitical risks of decarbonisation

As US Congress passes President Biden’s $1.9 billion Covid-recovery package, on top of the equally massive programmes implemented last year under Donald Trump’s administration, the political and fiscal spotlight is falling on the budgets of those departments which can be used to help fund such expenditure while relieving the pressure on government finances. Much the same is happening here in the UK, and in both instances defence spending is in the rifle crosshairs. As a barometer of the passion the subject excites, Bernie Sanders’ senate performance a few days ago was instructive: on full tub-thumping form, he made the social case for slashing defence dollars to “feed our people, put clothes on the backs of poor Americans”, to help realise their “expectations of, their right to, a better standard of living and higher wages!”. With Biden more understatedly making much the same case, the Chair of the Senate Budget Committee is clearly pushing on an open door among the Democrat leadership.

In the UK, Boris’s announcement in December of an additional £16 billion of spending on cyber and space defence comes at a price, largely thanks to the £17 billion ‘black hole’ in the MoD accounts. Robbing Peter to pay Paul, hence yet another Treasury-led defence review in the offing and a suggested reduction in the establishment of the Army from 82,000 to 72,000 (not quite enough soldiers to fill Old Trafford, let alone Wembley).

Why is this of relevance? Defence strategists are pointing to the opportunities and threats arising from the global decarbonisation programme. As the ice caps shrink at both poles thanks to global warming, Greenland and the Antarctic become viable for mining, being rich in the rare-earth minerals and ores increasingly in demand as the digital and decarbonisation revolutions gather pace. Not only those landmasses: it has also been suggested that mining the seabed in the deep, deep ocean, particularly in regions of high tectonic and volcanic activity where those same ores and minerals abound, is now a commercial possibility. And returning to the far north, as the pack ice retreats and becomes less enduring, so there is the possibility of year-round trans-polar maritime routes. The US, China and Russia are all sizing up the opportunities and the threats, each keeping a beady eye on the others’ movements, reading the signals of intent. Both China and Russia are investing heavily in naval capabilities (China now has the largest navy in the world, though lags well behind the US in aircraft carriers) and, while nobody is predicting a hot war, the potential for diplomatic or military stand-offs over strategic maritime assets is only likely to grow. While many treated Donald Trump’s unsubtle overtures to ‘buy’ Greenland from Denmark as a joke, in reality he was deadly serious. In the North Atlantic, Denmark becomes a key strategic player through its ownership of both Greenland and the Faeroe Islands, the latter already becoming one of the most secretive and sensitive of NATO’s watching and listening posts, keeping tabs on both the Russians and Chinese.

From an investment standpoint, while peripheral to current events and pre-occupations, however glacially and imperceptibly, these new and growing risks will be factored into longer-term risk premia.

We will continue to publish market updates and analysis, so please check in again with us soon.

Stay safe.

Chloe

18/03/2021

Team No Comments

Brewin Dolphin – Markets in a Minute

Please see below the latest ‘Markets in a Minute’ article from Brewin Dolphin received late yesterday afternoon – 16/03/2021.

Equities reach new highs as bond yields retreat

Global equities performed strongly last week, as bond yields retreated and investors turned their attention to encouraging economic data.

Most of the major US benchmarks reached new all-time highs. The Dow soared 4.1%, while the Nasdaq gained 3.1% and the S&P 500 added 2.6%. Tesla and other high-growth stocks enjoyed strong gains as fears about higher interest rates subsided.

Stocks in Europe were boosted by the passing of US president Joe Biden’s $1.9trn stimulus bill, as well as the European Central Bank’s pledge to speed up its emergency bond purchasing programme to counter rising borrowing costs. The pan-European STOXX 600 gained 3.5% and Germany’s Dax surged 4.2%.

The FTSE 100 ended the week nearly two percentage points higher, after data showed UK economic output fell by 2.9% between December and January – less than economists’ forecasts of a 4.9% contraction. Over in Asia, China’s Shanghai Composite slipped 1.4% amid concerns that authorities could reduce stimulus measures as the economy recovers.

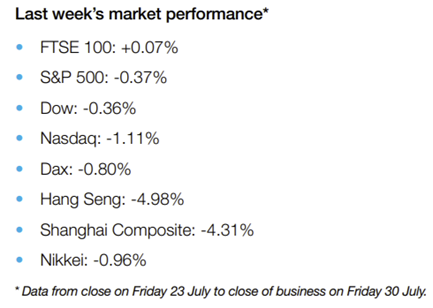
Last week’s market performance*

  • FTSE 100: +1.97%
  • S&P 500: +2.64%
  • Dow: +4.07%
  • Nasdaq: +3.09%
  • Dax: +4.18%
  • Hang Seng: -1.23%
  • Shanghai Composite: -1.40%
  • Nikkei: +2.96%

*Data from close on Friday 5 March to close of business on Friday 12 March.

Wall Street rallies ahead of consumer spending spree

US stocks rallied on Monday as the roll out of stimulus cheques over the weekend fuelled expectations of a consumer spending spree. After a whipsaw session, the S&P 500 ended the day up 0.64%, reaching a new all-time high of 3,968.77. The Nasdaq rose 1.1% after technology shares recovered lost ground.

European shares ended Monday on a mixed note, following negative headlines around the Continent’s vaccination efforts and the safety of the AstraZeneca-Oxford vaccine. The STOXX 600 was flat at 423.1, while Germany’s Dax slipped 0.3%.

The FTSE 100 dipped 0.2% as commodity stocks, including BP, Royal Dutch Shell and BHP, underperformed. Bank of England governor Andrew Bailey said he expected inflation to approach the 2% target soon, but that he was cautious about whether the trend was sustainable amid continuing economic uncertainty. Ipsos MORI’s latest political monitor found 43% of Britons think the economy will improve over the next 12 months, while 41% think things will get worse.

The FTSE 100 was up 0.6% at Tuesday’s open, with investors optimistic that the US Federal Reserve will maintain a dovish stance on interest rates at its meeting this week.

US economic data cheers investors

Last week saw a raft of encouraging economic data from the US. Initial weekly jobless claims fell to their lowest level since November, at 712,000. Continuing claims dropped to 4.1m, their lowest level in a year. This helped to fuel a jump in the University of Michigan’s preliminary consumer sentiment index from 76.8 at the end of February to 83.0 in March.

The US is also progressing well in its roll out of Covid-19 vaccines, administering a new high of five million doses over the 6-7 March weekend. On Thursday, Biden told states to make all American adults eligible for vaccines by 1 May and set a goal of 4 July for gatherings to celebrate ‘independence’ from the pandemic. On the same day, Biden signed into law the $1.9trn American Rescue Plan Act, which provides $1,400 direct payments to individuals making up to $75,000 annually, $350bn in aid to state and local governments, and $14bn for vaccine distribution.

Last week’s US consumer price index (CPI) revealed an acceleration in the headline CPI, driven by rising commodity prices. Goods inflation rolled over slightly on a year-on-year basis in February, but services inflation continued to move lower.

The data highlights how the pandemic has, in aggregate, negatively impacted services demand while bolstering demand for tangible goods.

UK economy shrinks less than expected

The UK economy shrank by less than feared in January, despite the country re-entering lockdown. Gross domestic product was 2.9% lower than in December, according to the Office for National Statistics. Economists polled by Reuters had expected a contraction of 4.9%.

Following the latest data, economists are now predicted a 2% contraction in the first quarter of 2021 – half the 4% hit forecast by the Bank of England only last month. Retail sales figures also brought some cheer, with sales growing by 1.0% year-on-year in February following a 1.3% decline in January.

On the flipside, exports of goods to the EU slumped by 40.7% in January, while imports plunged by 28.8%. These are the largest drops on record, although there was a delay in gathering some data and there were signs of a pick-up towards the end of the month.

Chinese market continues sell-off

The sell-off in Chinese stocks continued last week, resulting in the CSI 300 posting its sharpest correction since the height of the Covid-19 crisis in March last year.

Alongside this sell-off has been a global rotation away from growth stocks into value stocks. In the last couple of years, China has increasingly become a growth-exposed equity market. Electric vehicle maker NIO has sold off almost 40%, and ecommerce companies Pinduoduo and Meituan have both sold off more than 30%.

Concerns about liquidity and credit stimulus are driving the sell-off. To prevent asset bubbles and contain ballooning debt, it is expected that the authorities will raise interest rates and restrict credit. However, with China heading into the centenary of the Chinese Communist Party in July, it is likely that the authorities will go slow in terms of withdrawing stimulus.

The so-called ‘national team’, which includes the sovereign wealth fund, state affiliated brokers, and the national social security fund, will also be on hand to limit the downside to major corrections.

Another quick update from Brewin Dolphin, regular market updates like this are useful for keeping up to speed with developments in the markets.

Please continue to check back for our regular blog posts and updates.

Charlotte Ennis

17/03/2021

Team No Comments

Legal & General Investment Managers Blog – Supercycle versus superpower

Please see below a blog received yesterday afternoon from Legal & General Investment Managers, which details their views on China and the bond markets in the US and Europe:

Please continue to check our Blog content for advice and planning issues and the latest investment, markets and economic updates from leading investment houses.

Please keep safe and healthy.

Carl Mitchell – Dip PFS

IFA and Paraplanner

16/03/2021

Team No Comments

AJ Bell Investment Insight: The questions facing UK gilts

Please see below for AJ Bell’s latest Investment Insight article, received by us yesterday 14/03/2021:

In some ways, markets had little to digest in the immediate wake of the Budget, as so much of the chancellor of the exchequer’s speech had made its way into the newspapers the previous weekend.

Rishi Sunak did come up with a couple of surprises all the same, in the form of the superdeduction for capital investment and his plan for eight freeports, designed to boost the UK’s trade flows in a post-Brexit world. The key issues raised by the Budget, at least from an investment perspective, passed unasked:

  • Why should anyone lend the UK money (and therefore buy its government bonds, or gilts) when it does not have the means to pay them back?
  • Why should anyone lend money to someone who cannot pay them back in return for a yield of just 0.77% a year for the next ten years (assuming they buy the benchmark 10-year gilt)?
  • Why would anyone buy a 10-year gilt with a yield of 0.77% when inflation is already 0.7%, according to the consumer price index, and potentially heading higher, especially if oil prices stay firm, money supply growth remains rampant and the global economy finally begins to recover as and when the pandemic is finally beaten off?

Anyone who buys a bond with a yield of 0.77% is locking in a guaranteed real-term loss if inflation goes above that mark and stays there for the next decade.

In sum, do UK government bonds represent return-free risk? And if so, what are the implications for asset allocation strategies and investors’ portfolios?

GILT YIELDS ON THE CHARGE

The benchmark 10-year gilt yield in the UK has surged of late. It is not easy to divine whether this is due to the fixed-income market worrying about inflation or a gathering acknowledgement that the UK’s aggregate £2 trillion debt is only going one way – up. But the effect on gilt prices is clear, since bond prices go down as yields go up (as is also the case with equities).

This is inevitably filtering through to exchange-traded funds (ETFs) dedicated to the UK fixed income market. The price of two benchmark-tracking ETFs has fallen, albeit to varying degrees. The instrument which follows shorter-dated (zero-to-five year) gilts has fallen just 2% since the August low in yields.

Meanwhile, the ETF which tracks and delivers the performance of a wider basket of UK gilts (once its running costs are taken into account) has fallen 8% since yields bottomed last summer.

That 8% capital loss is at least a paper-only one, unless an investor chooses to sell now, but the yield on offer does not come even close to compensating the holder for that paper loss, which supports the view that bonds now represent return-free risk.

SAVING GRACES

However, the higher bond yields go, the greater the return they offer and that means at some point investors may decide that the rewards are sufficient compensation for the risks, especially as three arguments could still support exposure to UK gilts.

  • The market’s fears of inflation could be misplaced. Bears of bonds have been growling about record-low interest rates and record doses of quantitative easing would lead to inflation for over a decade – and it has not happened yet.

If the West does turn Japanese and tip into deflation, even bonds with small nominal yields would look good in real terms and possibly better than equities, which would do poorly into a deflationary environment, at least if the Japanese experience from 1990 until very recently is a reliable guide.

  • The UK’s financial situation may not be quite as bad as it seems. Yes, the national debt is growing but the Bank of England’s monetary policy is keeping the interest bill to manageable levels.

The Government’s interest bill as a percentage of GDP has hardly ever been lower. That buys everyone time and is also why Sunak is tinkering with taxes, to convince bond vigilantes and lenders alike that the UK can and will repay its debts, as
it has every year since 1672 under King Charles II. A big leap in bond yields (borrowing costs) would be expensive.

  • The Bank of England could move to calm bond markets with more active policy. Whether that calms inflation fears is open to question but financial repression (see a recent edition of this column) could yet come into play, supporting bond prices and reducing yields.

In sum, no-one has a crystal ball. Therefore, bonds could yet have a role to play in a well-balanced portfolio over time, but it is inflation, rather than risk of default, that looks likely to be the greatest threat to any holder of gilts.

Please continue to utilise these blogs and expert insights to keep your own holistic view of the market up to date.

Keep safe and well

Paul Green DipFA

15/03/2021

Team No Comments

Asia’s decade: Getting ahead of the growth opportunity

Please see the below article from JP Morgan received early this morning:

‘By 2030, we expect the increase in annual Chinese spending power to be larger than the current size of the German and UK economies combined.’ – Mike Bell & Tilmann Galler

Rising incomes in Asia will probably be the most important economic and investment story of the 2020s. Asia is home to 60% of the world’s population, with China and India each accounting for about 18% of the global total. As incomes rise, the Asian middle class is expected to grow by about 1.2 billion people by 2030, significantly boosting consumption. As a result, we think Asia is an investment opportunity that’s simply too big to ignore and warrants a larger place in many portfolios.

China

Visitors to Shanghai would be forgiven for thinking that China’s development is mostly behind it. Growth has already been spectacular, with China’s share of global GDP rising from just 2% in 1990 to about 16% in 2020. What’s more, China is responsible for 35% of global demand for luxury goods. So it’s understandable that there’s a common perception that China is already rich.

However, travelling east of the developed coastal regions provides a very different picture of the country – and the ongoing potential for economic catch-up is clear. While there are certainly many Chinese billionaires, average GDP per capita is only around USD 10,000 (Exhibit 1).

Ongoing urbanisation will drive further increases in productivity and incomes

Exhibit 1: Urbanisation, nominal GDP per capita and population size

Urbanisation rates, %, and GDP per capita, USD, bubble size is population

That figure represents impressive growth, from only USD 1,000 in 2000, but remains a long way behind developed economies such as the US. As inland regions urbanise (Exhibit 2) and develop, productivity will rise, such that China is expected to grow by about 4.4% per year on average in real terms over the next decade, despite an outright decline in the working age population. That means GDP and incomes should be about 50% larger by 2030.

There’s still plenty of urbanisation ahead in Asia

Exhibit 2: Urbanisation rates over time

% of population

An expected increase in incomes from about USD 10,000 per person to USD 15,000 per person may not sound that much by western standards. But multiply that increase in incomes by 1.4 billion people and you get an idea of the scale of the opportunity: a real increase in consumption of about USD 7 trillion. That’s an increase in annual Chinese spending power larger than the current size of the German and UK economies combined. This presents considerable growth opportunities in a wide range of goods and services — from premium food brands to insurance, healthcare and online tutoring.

Trade tensions are likely to persist between the US and China, and China is likely to be under increasing pressure to meet higher environmental and labour standards. But Beijing’s most recent five-year plan demonstrates the action the Chinese government is already taking in these areas, including an ambition to be carbon neutral by 2060. It’s also worth remembering that exports to the US account for only 3% of Chinese GDP. Investors who refrain from investing in China because of trade tensions are likely to be waiting a very long time, and risk missing out on the bigger picture of rising Chinese consumption.

India

While China’s economy is likely to grow by the largest amount in absolute terms, India is likely to deliver the fastest growth rate of any major country over the next decade. With over 480 million Indians under the age of 20 — considerably more than the entire 370 million population of North America — the working age population of India is set to grow strongly. From a much lower base of GDP per capita of only around USD 2,000 (Exhibit 1), we expect real growth of 6.9% per year on average over the next decade. That should lead real incomes to approximately double over the next decade. Again, while that may not sound like much, it could mean there are about a billion Indians in the middle class in 10 years’ time, with incomes increasing to a point at which many more households can afford higher-quality food products and financial services such as life insurance.

Overall, we think investors with a long-term investment horizon will benefit from focusing on the incredible opportunity presented by rising incomes and consumption in China, India and the rest of Asia.

The income opportunity

The global financial crisis followed by the Covid-19 pandemic pushed developed market bond yields significantly lower. Investment grade bond yields in the US and Europe are close to historical lows and 26% of developed market government bonds have a negative yield.

As a consequence, an increasing number of investors need to look beyond their home region to find positive real yields for the fixed income part of their portfolios. From that perspective, Asian bond markets look compelling. Asian investment grade bonds offer a yield pickup of between 2% and 3% over US and euro bonds, while fundamentals look relatively robust.

As in the developed world, debt in Asia has increased because of the pandemic, but total debt to GDP is still close to or below the level of most G7 countries. So investors willing to take the currency risk can add higher-yielding Asian bonds with an average rating of single A. Despite a higher correlation to equities than developed market government bonds, Asian bonds are still able to provide diversification benefits for portfolios (Exhibit 3).

Asian bonds provide higher yields, while still offering some diversification

Exhibit 3: Yields and correlations of fixed income returns to equities

% yield and 10-year correlation of monthly returns with MSCI AC World

Chinese renminbi bonds look particularly appealing. China’s early success in containing the Covid-19 pandemic knocked its economic cycle out of sync with the rest of the world, and with the Chinese central bank providing a less expansionary monetary policy response compared to developed economies, we would expect correlations with developed market assets to remain low for the time being.

In the past, restricted access and limited currency convertibility prevented Asian bond markets from playing a major role for global investors. But with the rising financing needs of the region, this is changing rapidly. Following the opening of the USD 15 trillion local renminbi bond market to overseas buyers, yield-starved international bond investors now have the opportunity to invest in Chinese bonds with yields north of 3%. Net cumulative foreign purchases of Chinese bonds have already accelerated by over USD 400 billion in the past four years. As has been seen since the opening of the local equity markets, index providers are beginning to reflect the growing importance of Chinese bonds, with increasing weights in bond indices likely to generate significant amounts of passive inflows in the coming years. For investors, it might be worth getting ahead of those flows.

Equity valuations

It’s not only within fixed income that valuations look more attractive in Asia than in the developed world. MSCI Asia ex Japan trades on a forward price/earnings ratio (PE) of about 16x, below Europe and significantly cheaper than the 22x earnings for the US. Valuations in India are similar to the US, but we expect the Indian economy to grow at 6.9% over the next decade, compared with 1.8% for the US. China, on about 16x earnings, is cheaper than Europe, despite the fact that we expect China’s economy to grow at 4.4%, compared with 1.3% for Europe, over the next decade. In short, long-term growth is available at a more reasonable price in Asia than elsewhere in the world.

The growth opportunity in equities

The combination of favourable demographics and fast-growing incomes continues to support the strategic investment case into Asia. Nevertheless, sceptics could argue that over the past 10 years Asian equities have not lived up to the high expectations investors had for this fast-growing region. Asian equities ex Japan have underperformed developed market equities by more than 2% per annum since 2011 – proof that high GDP growth doesn’t always translate into superior equity market performance. So why should it be any different in this new decade?

After a period of disruptive forces including the end of the commodity supercycle, trade conflict and a strong US dollar, fundamentals are shifting significantly in Asia’s favour.

We identify three structural trends that should support Asia:

  1. Technology adoption. Worldwide technology spending is projected to reach USD 3.9 trillion in 2021. IT hardware and semiconductor companies in China, Taiwan and Korea have become global market leaders in their industries. The rise of artificial intelligence, the move to electrical vehicles and autonomous driving, and the global rollout of 5G technology will keep demand for hardware made in Asia high. India has become a hub for the market-leading IT services companies, benefiting from an estimated 6-8% increase in digital transformation spending worldwide per year over the next four years. Outside the US, Asia is the only region with a large representation of the tech sector in its equity markets. The IT sector and the communication sector combined represent a third of the overall market cap.
  2. Middle class miracle. By 2030, roughly two thirds of the global middle class will live in Asia, and they are projected to spend an additional $18 trillion annually. Since 2009, Asian companies with a strong domestic focus have quadrupled their earnings, outperforming more export-oriented businesses. It’s also remarkable that domestic-focused earnings have shown significantly less volatility (Exhibit 4). Policymakers in the region will be eager to ensure that Asian companies get their fair share in satisfying future domestic demand. The new RCEP (Regional Comprehensive Economic Partnership) free trade agreement, which covers 10 ASEAN countries and China, Japan, Korea, Australia and New Zealand, can be seen as one step towards incentivising more intra-regional trade and production.
  3. The A-share opportunity. In equity markets, China is still punching below its weight (Exhibit 5). By the end of the decade, China will likely be the largest economy in the world. One of the main obstacles for foreign investors used to be the lack of access to the full opportunity set of listed Chinese corporations. But the opening of the local stock market to foreign investors in August 2016 propelled inflows from foreign investors. Foreign ownership of onshore Chinese equities has increased to 3.8% of total market cap. Although this represents an almost trebling in foreign equity holdings in the past four years, foreign ownership levels are still way below the 27% seen in the US or 55% in the UK. So China A-shares still have a lot of catching up to do. A fast-growing domestic economy and the prospect of higher index inclusion in the future will likely continue to attract foreign capital and support demand for A-shares in the coming years.

Domestic-focused earnings have grown strongly

Exhibit 4: Domestic vs. Exports-Oriented Asian companies

MSCI AC Asia Pacific ex-Japan, earnings per share, Jan. 2009 = 100

China’s weight in bond and equity benchmarks is well below its share of global GDP

Exhibit 5: China’s weight in global GDP, equities and bond markets

% of world GDP and market capitalisations

Conclusion

Favourable trends in urbanisation and the rapid growth of the middle class provide a strong growth backdrop for the region. Better containment of the pandemic and a more moderate policy response mean investors can access higher bond yields and superior earnings growth potential within equities at more reasonable valuations than elsewhere.

The improving accessibility of local Asian bond and equity markets, together with the growing depth of investable securities and liquidity, is further enhancing the attractiveness of the region for investors. Our 2021 Long-Term Capital Market Assumptions suggest Asian equities have the potential to outperform developed markets by 2.2% a year over the next 10 to 15 years. Mounting signs that the US dollar bull market is fading further reinforce our view that the next 10 years might go down as the Asian decade.

Please continue to check back for more of our regular blog content including market updates and insights like this article.

Andrew Lloyd

15/03/2021

Team No Comments

Daily Investment Bulletin

Please see below market update received from Brooks Macdonald yesterday afternoon. The commentary provides investment analysis linked to global news.

What has happened

Whilst there was a cyclical tilt to yesterday’s equity moves, it was a far calmer backdrop with sub 1% moves for most headline US and European markets. Technology pulled back a little, however this is within the context of Tuesday’s exuberance. The US market is within a hair’s breadth of hitting an all time high which is quite remarkable given the amount of ink that has been expended talking about market volatility.

US Auction and Inflation update

The auction of $38 billion of US 10 year bond yields followed in the footsteps of the 3 year and was well received by the market. Bond yields fell again as bond investors had a sigh of relief albeit a more modest sigh after imminent fears of an auction inspired spike had subsided earlier in the week. The core (ex Energy and Food) US CPI figures came in modestly below market expectations at 1.3% year on year gain. Of course, as we have said on multiple data points, this data is arguably less useful as we haven’t yet seen the recovery or impact of the latest round of stimulus and equally the comparable a year earlier was muddied by the beginning of COVID restrictions. That said, investors were comforted that inflation remains under control for the time being.

US/China

In 2018 and 2019 one of the largest geopolitical risks was the ongoing trade war between the US and China. Whilst the Biden administration is expected to take a less antagonistic stance with China, it is not expected to entirely retreat from the battle. Yesterday the White House announced a summit with Chinese officials in Alaska in a weeks’ time. The agenda for this hasn’t been announced but Secretary of State Blinken said topics would include areas ‘where we have deep disagreements’, so the meeting isn’t merely to exchange pleasantries. This latest development is a reminder to markets that a change in the US Presidency has not removed the risk of a ‘tough on China’ stance that has bipartisan support from Congress.

What does Brooks Macdonald think

With yesterday’s inflation data and auction results giving investors little to worry about there was a sense of calm in markets. It is far too early for us to conclude that inflation will remain under control as the key data points will arrive when the recovery kicks into gear.

Please check in again with us soon for further updates.

Stay safe.

Chloe

12/03/2021

Team No Comments

UK Equities: What does ESG mean to us?

Please see the below article from Invesco which we received late yesterday afternoon:

Key takeaways

  1. Investing in stocks which have the right ESG momentum behind them can be a positive way for our funds to potentially generate alpha
  2. We draw upon ESGintel, Invesco’s proprietary tool, which helps us to better understand how companies are addressing ESG issues
  3. Engaging with companies to understand corporate strategy today in order to assess how this could evolve in the future

Our focus as active fund managers is always on finding mispriced stocks and ESG integration underpins our investment process at every stage.

The incorporation of ESG into our investment process considers ESG factors as inputs into the wider investment process as part of a holistic consideration of the investment risk and opportunity, from valuation through investment process to engagement and monitoring.

The core aspects of our ESG philosophy include materiality; ESG momentum; and engagement.

  • Materiality refers to the consideration of ESG issues that are financially material to the corporate or issuer we are analysing.
  • The concept of ESG Momentum, or improving ESG performance over time, indicates the degree of improvement of various ESG metrics and factors and help fund managers identify upside in the future. We find that companies which are improving in terms of their ESG practices may enjoy favourable financial performance in the longer term.
  • Engagement is part of our responsibility as active owners which we take very seriously, and we see engagement with companies as an opportunity to encourage continual improvement.

Dialogue with portfolio companies is a core part of the investment process for our investment team. As such, we often participate in board level dialogue and are instrumental in giving shareholder views on management, corporate strategy, transparency, and capital allocation as well as wider ESG aspects.

ESG integration is an ongoing strategic effort to systematically incorporate ESG Factors into fundamental analysis. The aim is to provide a 360-degree valuation of financial and non-financial materially relevant considerations and to help guide the portfolio strategy.

Our investment process has four stages. In this note we go through in detail how ESG is integrated into each stage of our process.

Idea Generation

Ideas come from many sources – our experienced FMs, other team members or investment floor colleagues, various company meetings, and by exploiting the intellectual capital of our sell side contacts. We see it as important to spread our nets as wide as possible when trying to come up with stock ideas which may find their way into our portfolios. We remain open minded as to the type of companies we will consider. This means not ruling out companies just because they happen to be unpopular at that time and vice versa.

ESG can create opportunities too – for example, the benefits of moving towards more sustainable sources of energy like wind, solar and hydroelectric power generation. This was one of the reasons we became interested in some of our utility holdings which are held across several portfolios. This highlights the importance of opportunities brought about by ESG and not just the risks. ESG can also influence the timing and scale of a mispricing being corrected in the market.

To be clear, at this early stage of the investment process we typically would not rule out companies with a sub-optimal ESG score. Investing in stocks which have the right ESG momentum behind them – by focussing on fundamentals and the broader investment landscape – can be a unique way for our funds to potentially generate alpha.

Fundamental Research & ESG Analysis

Research is at the core of what we do and is what the investment team spends most of its time doing. The key is to filter out those ideas which aren’t aligned with our investment philosophy and concentrating on those where we see the strongest investment case. Our fundamental analysis covers many drivers, for example, corporate strategy, market positioning, competitive dynamics, top-down fundamentals, financials, regulation, valuation, and, of course, ESG considerations, which guide our analysis throughout. The key drivers will differ according to each stock.

We use a variety of tools from different providers to measure ESG factors. In addition, at Invesco, we have developed ESGintel, Invesco’s proprietary tool built by our Global ESG research team in collaboration with our Technology Strategy Innovation and Planning (SIP) team. ESGintel provides fund managers with environmental, social and governance insights, metrics, data points and direction of change. In addition, ESGintel offers fund managers an internal rating on a company, a rating trend, and a rank against sector peers. The approach ensures a targeted focus on the issues that matter most for sustainable value creation and risk management.

This provides a holistic view on how a company’s value chain is impacted in different ways by various ESG topics, such as compensation and alignment, health and safety, and low carbon transition/ climate change.

We always try to meet with a company prior to investment. Based on our fundamental research, including any ESG findings, we focus on truly understanding the key drivers and, most importantly, the path to change. This helps us better understand corporate strategy today and how this could evolve in the future. Today, the subject of ESG is increasingly part of these discussions, led by us.

Portfolio Construction

We aim to create a well-diversified portfolio of active positions that reflect our assessment of the potential upside for each stock weighted against our assessment of the risks. Sustainability and ESG factors will be assessed alongside other fundamental drivers of valuation. The impact of any new purchases will need to be considered at a fund level. How will it affect the shape of the portfolio having regard to fund objectives, existing positions, overall size of the fund, liquidity and conviction?

We do not seek out stocks which score well on internal or third party research simply to reduce portfolio risk. We ask the question, “Why does the idea deserve a place in the portfolio?” We ask this because there is a competition for capital, a new idea will require something else to be sold or reduced so that it can be included.

Ongoing Monitoring

Our fund managers and analysts continuously monitor how the stocks are performing as well as considering possible replacements. Are the investment cases strengthening or weakening? Are their valuations reflecting the companies’ prospects appropriately? Is the company performing from an ESG perspective and are the valuations fairly reflecting the progress being made or not? Are the anticipated key drivers playing out or not? These questions, and their answers, are all of equal importance to us.

How do we monitor our holdings from an ESG perspective? Again, the same resources used during the fundamental stage are available to us. Our regular meetings with the management teams of the companies we own provides an ideal platform to discuss key ESG issues, which will be researched in advance. We draw on our own knowledge as well as relevant analysis from our ESG team and data from our previously mentioned proprietary system ESGintel which allows us to monitor progress and improvement against sector peers. Outside of company management meetings we constantly discuss as a team all relevant ESG issues, either stimulated internally or from external sources.

Additional ESG analysis is carried out by the team, when warranted, on particular companies. Depending on the particular case this is often in conjunction with the ESG team. Such cases would be those that are more controversial, considered to be higher risk and viewed poorly by ESG providers, resulting in a valuation discount. We don’t just look at the specific issue considered to be higher risk either, for example the environmental risk of an oil company, but all areas of ESG. This means undertaking extensive analysis of social and governance policies and actions at the same time. We would note that this analysis is an ongoing process, typically involving multiple engagements with the company over a long period of time. All ESG discussions and interactions are written up – including our views and thoughts – with a section solely dedicated to ESG. Likewise, research undertaken by the ESG team is available to the entire Henley investment floor, and wider business. Further analysis could be warranted as a result of these discussions.

Challenge, Assessing & Monitoring Risk

In addition to the above, there are two more formal ways in which our funds are monitored:

There is a rigorous semi-annual review process which includes a meeting led by the ESG team to assess how our various portfolios are performing from an ESG perspective. This ensures a circular process for identifying flags and monitoring of improvements over time. These meetings are important in capturing issues that have developed and evolved whilst we have been shareholders. It is our responsibility to decide if it is appropriate, or not, to investigate these issues in more detail. We may ask the ESG team to assist in undertaking more analysis or discuss such issues with the company themselves or external brokers.

There is also the ‘CIO challenge’, a formal review meeting held between the Henley Investment Centre’s CIO and each fund manager. Prior to the meeting, the Investment Oversight Team prepare a detailed review of a portfolio managed by the fund manager. This review includes a full breakdown of the ESG performance using Sustainalytics and ISS data, such as the absolute ESG performance of the fund, relative performance to benchmarks, stocks exposed to severe controversies, top and bottom ESG performers, carbon intensity and trends. The ESG team review the ESG data and develop stock specific or thematic ESG questions. The ESG performance of the fund is discussed in the CIO challenge meeting, with the CIO using the data and the stock specific questions to analyse the fund manager’s level of ESG integration. The aim of these meetings is not to prevent a fund manager from holding any specific stock: rather, what matters is that the fund manager can evidence understanding of ESG issues and show that they have been taken into consideration when building the investment case.

Conclusion

The regulatory landscape is rapidly evolving, which increasingly compels organisations and investors alike to clearly demonstrate their awareness of ESG issues in their decisions. Landmark initiatives such as the European Union’s new Sustainable Finance Disclosure Regulation (SFDR) are at the forefront of this shift.

We believe that our approach is honest, coherent and pragmatic. The principles behind ESG deserve to be embedded in an investment framework which encourages positive change. Coupling this with a focus on valuation is, to our minds, the best way to deliver strong investment outcomes for our clients’ long term. This reinforces our fundamental belief that responsible investing demands a long-term view and that a stakeholder-centric culture of ownership and stewardship is at the heart of ESG integration.

This is a good article and insight into how Invesco integrate ESG into their investment process. We would expect more fund managers to start publishing their ESG process (if they haven’t already!).

Please keep an eye out for further ESG related content from us, along with our usual market commentary and blog updates.

Andrew Lloyd

11/03/2021