Team No Comments

Invesco Investment Intelligence updates – 14/06/2021

Please see below for one of Invesco’s latest Investment Intelligence Updates, received by us yesterday 14/06/2021:

After April’s US CPI upside surprise, last week’s May reading was eagerly anticipated, albeit with a degree of trepidation. It didn’t disappoint. Headline CPI came in at 0.6%mom and 5%yoy, its highest level since 2008 (inflation peaked at 5.6%yoy then), while Core CPI rose even more at 0.7%mom, leaving it at 3.8%yoy, its highest since 1993. Both were 30bp above consensus expectations on a year-on-year basis. Strength was largely led by what are seen as “transitory” components, such as used cars (7.3%), car and truck rental (12.1%) and airfares (7%), even if there are other elements of consumer prices, such as shelter costs, that show more sustainable price pressures. Notwithstanding that we are probably close or at peak inflation as the impact of the lockdown starts to fall out of the calculation. How quickly and how far it will drop will be a function of whether rising costs, corporate pricing power and rising wages in a stimulus fuelled economy translate into more persistent inflation. For now, the Federal Reserve and increasing numbers of investors, witness a 10yr UST that is at its lowest level since early March, appear unconcerned about this risk. Time will tell whether this complacency is warranted or not, but it clearly remains a significant tail risk for financial markets.

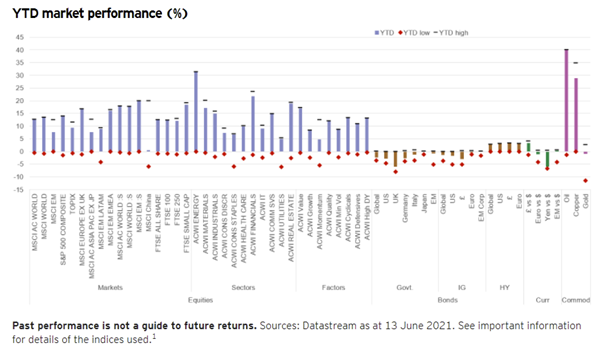
Global equity markets finished the week at a fresh all-time high, with a rise of 0.6% for MSCI ACWI. It is now up 12.7% YTD. DM (0.6%) led EM (flat), with both the US and Europe ex UK hitting new all-time highs, up 13.8% and 16.7% respectively YTD, with the latter the strongest major market of the week (1.2%). Small Caps (1.3%) outperformed again, hitting new all-time highs, with DM (1.3%) ahead of EM (1.1%). It was a rare week of Tech and tech-related sector outperformance, led by IT (1.6%). HealthCare (2.8%) was the best performing sector. Real Estate also had a good week (2.1%) and is now the third best performing sector YTD, up 18.8%, behind Energy and Financials. Lower bond yields weighed on Financial sector performance, while commodity sectors also lagged. Sector performance underpinned a strong relative performance week for Growth (1.4%) versus Value (-0.3%), while Quality (1%) had a good week too. UK equities were slightly ahead (All Share 0.9%) on the back of a good week for large caps (FTSE 100 0.9%) on strength in HealthCare, Telecoms and Energy.

Government bonds had a strong week with yields pushed lower by the belief that US inflationary pressures are transitory and a dovish stance at the latest ECB meeting. 10yr USTs and Gilts fell 10bp and 8bp respectively, taking them to their lowest levels since early March. They are now down 28bp and 18bp below their YTD highs, but are still higher than their starting level, hence the negative returns YTD from the asset class. Bunds and BTPs fell 6bp and 12bp. The better tone in government bond markets supported a good week for credit markets, where IG outperformed HY globally. IG yields fell 5bp with spreads narrowing by 2bp. The latter at 91bp are within touching distance of their post-GFC low (87bp). In HY a decline of 5bp in yields took them to all-time record lows (4.54%), but spreads at 353bp remain somewhat above their post-GFC lows (311bp).

The US$ edged higher over the week with the US Dollar Index up 0.5%, its third weekly gain, leaving it up 0.7% for the year. The Euro and £ were down -0.4% and -0.3% respectively.

Commodities overall were down slightly on the week with a -0.6% loss for the Bloomberg Commodity Spot Index, which is up just under 22% YTD. Brent, up 0.9%, hit its highest level ($73) in two years. In its latest monthly report, the IEA said that OPEC+ would need to boost output to meet demand that is set to recover to pre-pandemic levels by the end of 2022. Copper was up marginally too, 0.4% on the week, after a late rally on Friday as investors bet that China’s sales of strategic reserves would have a muted impact on demand. Gold edged lower (-0.6%) as it continued to consolidate around the $1900 level.

Andy Haldane, the Bank of England’s outgoing Chief Economist, described the UK’s housing market as being “on fire” last week. Recent House Price indices from the Halifax and Nationwide, the two biggest mortgage lenders, showed annual price growth of 9.6%yoy and 10.9%yoy respectively. These were the fastest rates of growth since 2007 and 2014 respectively and a lot faster than the rates of growth (3% and 3.5% CAGR respectively) seen in the decade leading up to the pandemic, described by another senior BoE official as housing’s “Quiet Decade”. And last Thursday’s RICS House Price Net Balance reading, which measures the breadth rather than magnitude of price falls or rises over the previous 3 months, hit +83% – its highest level since the housing boom of the late 1980s. Regionally it hit +100% in the N, NW and SW of England and Wales, while London was the standout laggard at just +46%.

All in all, a very uncharacteristic housing market, which typically fall and only recover slowly in severe economic contractions. This time around a combination of factors have delivered a very different market outturn: easing of lockdown restrictions have released pent-up demand. The government has supported the market through the Stamp Duty holiday (due to finish at the end of September), although it may not be as big a motivator for moving as some think. A recent survey by Rightmove shows that it is not the biggest motivation, with only 4% saying that they would abandon purchase plans if they missed the Stamp Duty deadline. Mortgage availability has improved, particularly for first-time buyers. Borrowing costs are low. Excess savings built up during the pandemic have provided cash for larger deposits. Finally, lifestyle factors (more space, relocating from large metropolitan areas) are at play. This has created an excess of demand over supply (the gap between new buyer enquiries and new instructions in the RICS survey was the widest since 2013) and, as with any commodity, when these imbalances occur prices tend to rise.

So, will the market remain “on fire”? In the RICS survey a national net balance of +45% envisage higher prices in the short-term (3m), while a greater +64% see them higher over 12m, although prices are only seen rising between 2-3%. Halifax and Nationwide also see the potential for further price rises in the coming months as most of the current demand drivers remain in place against a backdrop of a continued shortage of properties for sale. So, the fire may rage for a bit longer. Longer-term the RICS survey sees house prices appreciating by between 4-5% over the next 5 years. A still robust market, but certainly not to the same degree that we’re seeing currently. That would be a positive outturn for the economy. 

Key economic data in the week ahead

The Federal Reserve and Bank of Japan meet this week to set their respective policy rates. Inflation data is a feature in both Japan and the UK this week, with the UK also publishing its latest employment report. In China economic activity for May is also released. Finally, there will be a number of post-G7 meetings in Europe next week, which may stir some interest, particularly those between the US and EU and Biden’s meeting with Putin.

In the US Retail Sales data for May is released on Tuesday. A decline of -0.6%mom is expected after no growth the previous month as the impact of pandemic-relief cheques faded. On Wednesday the Federal Reserve’s FOMC meets. While no change in policy is expected, market focus will be on its update of its economic projections, particularly any changes to the rates dot plot, employment and inflation projections (after two strong prints recently), as well as any clues on the future tapering of QE. Last week’s Initial Jobless Claims fell to a new pandemic low of 376k as the number of job openings has surged. On Thursday a further decline to 360k is expected.

There are a number of important data points this week in the UK. April’s Unemployment figures are published on Tuesday. A small decline to 4.7% from 4.8% is forecast. This compares to a recent high of 5.1% and 3.8% before the pandemic struck. On Wednesday May’s CPI will come out. Headline inflation is estimated to have increased 0.3%mom to 1.8%yoy mainly due to higher fuel prices. This will take inflation back to the levels seen immediately pre-pandemic. Core is also expected higher at 1.5%yoy from 1.3%yoy. So, both measures remain below the Bank of England’s 2% target. Retail Sales for May are released on Friday. After the non-essential shops re-opening bounce last month, a more sedate 1.6%mom is expected this month for sales ex Auto Fuel.

In Japan the Bank of Japan meets on Friday and is expected to keep its policy unchanged. CPI on the same day is forecast to have increased in May, but the Headline rate is still expected to be negative at -0.2%yoy, while Core is seen as flat, having fallen 0.1%yoy in April.

Chinese activity data for May is released on Wednesday. Industrial Production is forecast to have risen 9.2%yoy, slightly lower than 9.8%yoy in April. Retail Sales are also expected lower, but still strong at 14%yoy compared to 17.7%yoy in April. Fixed Asset Investment is seen up 17%yoy from 19.9%yoy last month.

There is no significant data coming from the EZ this week.

Please continue to utilise these blogs and expert insights to keep your own holistic view of the market up to date.

Keep safe and well.

Paul Green DipFA

14/06/2021

Team No Comments

Weekly Market Commentary | US Consumer Price Index data release to be closely watched by markets

Please see below for Brooks MacDonald’s latest market update, received by us yesterday evening 07/06/2021:

  • Last Friday’s US jobs report missed expectations but the figures were welcomed by markets
  • With the EU vaccination programme progressing well, this week’s European Central Bank (ECB) meeting will be closely watched
  • US Consumer Price Index (CPI) on Thursday is arguably the most important data release so far in 2021

Last Friday’s US jobs report missed expectations but the figures were welcomed by markets

Equities ended the week strongly, despite the US jobs report coming in behind expectations. Growth equities were a particular beneficiary after the non-farm payroll report was released on Friday.

The May US employment report missed expectations but only mildly compared to the miss in April’s figures. May saw c.559,000 new jobs created on a headline basis and c.496,000 of those within the private sector1. Describing the gain, Federal Reserve Bank of Cleveland President Mester said that while the figures were positive, they fell short of substantial further progress which is the bar set by the Federal Reserve to consider tapering2. Beneath the numbers, the labour force participation rate fell, which may suggest that there is some hesitancy to return to workplaces or that stimulus measures have reduced the need to return to the workforce short term. The jobs report saw US 10-year Treasury yields fall as market participants priced in a slightly slower than expected recovery, which is showing fewer signs of acute labour shortages. It is those labour shortages that are particularly relevant given their role in driving supply side inflation as employers compete for workers.

With the EU vaccination programme progressing well, this week’s European Central Bank (ECB) meeting will be closely watched

This week’s main event is undoubtedly the US CPI number on Thursday, and this arguably represents the most important data release so far in 2021. Consensus estimates point to a 0.4% month-on-month increase in both the headline and core inflation rate, which would mean that core US inflation would move to 3.4% year-on-year3. This would be the highest level of core inflation since 19934. Of course, the massive reduction in economic activity last year skews these figures and this release, alongside June’s, sees a substantial uptick in inflation due to this ‘base effect’ alone. Thursday also sees the ECB’s meeting where the central bank, under less inflation pressure than the US, is likely to continue with its faster pace of asset purchases, for the short term at least. As the EU vaccination drive continues to gain momentum, an exit of this pandemic quantitative easing programme may be on the cards but probably not until the last quarter of this year.

US Consumer Price Index (CPI) on Thursday is arguably the most important data release so far in 2021

The US CPI number will be very closely watched by markets, not only for the core inflation figure but also what is driving the subcomponents. Last month, used cars were an outsized contributor to the figures but investors will be looking for signs of a broader increase in price pressures.

Please continue to utilise these blogs and expert insights to keep your own holistic view of the market up to date.

Keep safe and well

Paul Green DipFA

08/06/2021

Team No Comments

Legal & General: Our Asset Allocation team’s key beliefs

Please see below for Legal & General’s latest Asset Allocation Team Key Beliefs Article, received by us yesterday afternoon 22/02/2021:

The consumer economy

Tim Drayson, our head of economics, often warns us not to bet against the US consumer. Last week, the US retail sales numbers for January smashed forecasts and once again showed that stimulus works, especially direct cash payments to households. Around 25% of the $600 received by individuals earning $75,000 or less was immediately spent, generating a $30 billion bounce in retail sales across all categories. Perhaps as a sign that economic optimism is already well priced in, equity markets chopped around last week although Treasury yields have been drifting higher.

The price of everything…

Clients are asking whether stock markets are getting ahead of themselves. We push back on this. If equity prices move up in lockstep with your view of the future improving, you should become neither more nor less optimistic. Given we believe we are early in the cycle, the mantra should remain unchanged: stay long, buy the dips.

Price is no determinant of value or valuations; it is only useful in relation to what you get for what you’ve paid. Is $100,000 a lot for a car? It depends if it’s for a Golf or a Ferrari. This is one reason we use multiples to think about valuations. Multiples that have historically exhibited mean-reverting properties over the long run have had some predictive power for longer-term returns. Prices, though, are not mean reverting and tell you nothing about future returns.

We pay particular attention to relative valuation. The yield gap is one representative measure; it hasn’t moved much recently but is still high by historical standards. Moreover, early in the cycle it’s quite normal for valuations to shoot up. This rebound has, so far, looked quite similar to the one in 2009 in magnitude.

Our baseline is that this bull market will last until the next recession. There’s a lot of runway left before then, in our view, and we expect the S&P 500 to be materially higher before the bull market ends.

Real talk

Investors are becoming more worried about the rise in bond yields and the possible impact on equity markets. The recent choppiness in equities while yields have drifted up adds to their nervousness. Although we believe nominal and real yields will rise further (and by more than currently priced in the forwards), we think this should be well digested by equity markets. We note that the 2013 taper tantrum saw a 75 basis point spike in bond yields but ‘only’ a 6% correction in the S&P. (Tim recently discussed the possibility of new US tapering.)

Empirically, there’s not much evidence that rising real yields are particularly bad news for equities, especially from these very low levels. In fact, rising real yields have mostly been associated with higher equities. Historically, the correlation between real yields and equity markets has turned negative at much higher real yields.

It’s crucial to understand what is driving yield moves. As long as rising yields reflect a combination of higher inflation and better growth prospects, this should be positive for markets. Only when policymakers become worried should we be ready for change. Equity markets may panic when they see either a de-anchoring of inflation expectations or they need to bring forward the timing of policy normalisation. In our view, it is far too early for either of these, but clearly both need to be monitored very closely.

All about that base effect

The next round of stimulus is still being debated by Congress. Last week, Treasury Secretary Yellen commented that “the risk of doing too little is greater than of doing too much”. If such an approach is adopted, the direct uplift to household incomes will potentially be at least three times larger than included in the COVID relief bill at the end of 2020. This money should hit people’s accounts just as the US begins to re-open more fully. Alongside the excess household savings accumulated during the pandemic, this could fuel a surge in demand.

This makes us think about the implications of the money supply glut. None of us have seen money supply grow on the current scale, the only precedent being during the Second World War. Half of the increase in broad money supply sits directly in household accounts, and cash as a share of financial assets for non-financial corporates is at its highest levels since 1969. We believe that a significant amount of this cash will be spent, boosting growth, corporate profitability, and possibly inflation.

On inflation, we know there will be a pronounced base effect around the spring as prices fell sharply while the economy was locked down last year. This, plus later boosts from CPI components that were depressed by restrictions like airfares and hotel prices, could temporarily raise inflation above target-consistent levels.

The Federal Reserve has highlighted this potential outcome, with January’s minutes containing a discussion on why it would be prudent to look through this increase. This makes sense in our view as it is equally likely that inflation will fall back in the summer. Base effects reverse, and there are also some aspects of inflation that have been lifted by the pandemic but are likely to weaken once the economy reopens. Used-car prices are an example.

Further out, the inflation picture becomes much murkier. How much slack will be left in the economy? Does the jump in money supply matter? Are some of the structural disinflationary forces of the past decade, like technology, beginning to shift? How well anchored are inflation expectations?

We believe that inflation becoming high enough to constrain monetary policy is still a way off. But if we get there, central banks in developed markets might be surprised by how much they have to raise rates to reduce inflationary pressure. Money doesn’t play a role in their models, despite monetary aggregates generally being excellent predictors of economic aggregates, and they aren’t able to directly undo the monetary and fiscal one-two that’s been so effective at putting cash in consumers’ pockets.

Please continue to utilise these blogs and expert insights to keep your own holistic view of the market up to date.

Keep safe and well

Paul Green DipFA

23/02/2021