Team No Comments

AJ Bell: Why the dollar must be watched

Please see below for one of AJ Bell’s latest articles received by us yesterday 10/10/2021, looking at the importance of the US Dollar to Global Markets:

The International Monetary Fund’s quarterly Composition of Official Foreign Exchange Reserves report may not be everyone’s idea of bedtime reading but one trend immediately emerges from the latest data. The dollar is still – slowly – falling from favour as the globe’s reserve currency with non-US central banks.

As of June 2021, the dollar represented 59% of global exchange reserves, only a fraction above December’s 25-year low and way down from this century’s 73% peak, reached in 2001.

The creation of the euro may have something to do with this and the rise of the Chinese renminbi may be another, while the US may not have helped its cause with rampant deficit creation and money printing since 2009 (even if it is not on its own in either respect).

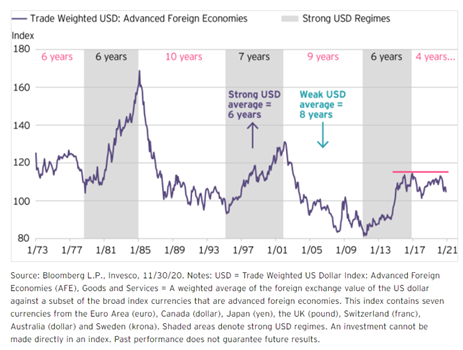
This has perhaps tempted some central banks to sell dollars in exchange for something else (gold or other currencies), because the greenback trades well below its early-century highs, as measured by the trade-weighted DXY index. The so-called ‘Dixie’ benchmark currently stands at 94 compare to its 2002 peak (for this century) of 120.2.

This may feed into the ‘demise of the dollar’ narrative that is popular with some economists and investors (even if that neglects the lack of credible alternatives, especially as the Chinese renminbi still represents just 2.6% of global foreign reserves). Yet for all of that, the DXY index trades at its highest mark for 2021 and all market participants, not just currency traders, will know that attention must be paid when the US currency starts to make a move, up or down.

Dollar dynamic

Two asset classes are particular sensitive to the dollar, at least if history is any guide.

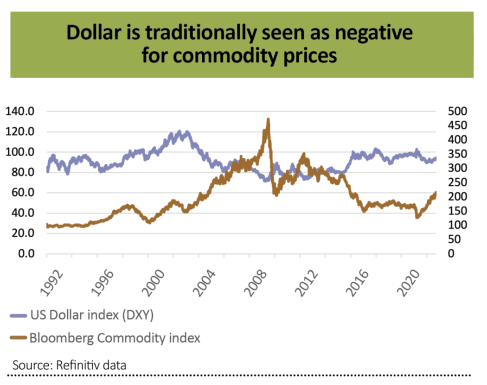
The first is commodities. All major raw materials, except cocoa (which is traded in sterling) are priced in dollars. If the US currency rises then that makes them more expensive to buy for those nations whose currency is not the dollar or is not pegged to it and that can dampen demand, or so the theory goes.

While the past is by no means a guarantee for the future, it can be argued that there is an inverse relationship between ‘Dixie’ and the Bloomberg Commodity Price index.

The second is emerging equity markets. They do not appear to welcome a strong dollar either, judging by the inverse relationship which seems to exist between the DXY and MSCI Emerging Markets benchmarks. Dollar strength at the very least coincided with major swoons in EM, or at least periods of marked underperformance relative to developed markets, during 1995-2000 and 2012-15. Retreats in the greenback, by contrast, appeared to give impetus to emerging equity arenas in 2003-07, 2009-12 and 2017-18.

This also makes sense, in that many emerging (and frontier) nations borrow in dollars and weakness in their currency relative to the American one makes it more expensive to pay the coupons and eventually repay the original loans.

Sovereign defaults are thankfully few and far between in 2021 – Suriname and Belize are the only ones that spring to mind – but a rising dollar could put more pressure on potential strugglers whose credit ratings continue to slip, notably Tunisia.

Bouncy buck

But before investors jump on the dollar bandwagon – and to conclusions – it must be worth asking why the US currency is back on a roll, and there are a couple of possibilities here.

The first is risk aversion. It may seem strange to say this as so many equity markets trade at or near all-time highs and so many sub-classes of the bond market offer record-low yields, but it may not be entirely a coincidence that the S&P 500 index has just served up its weakest month since the outbreak of the pandemic.

China’s regulatory crackdown, and signs of an accompanying economic slowdown, may be tempting some investors to seek out a haven asset and the dollar, as the globe’s reserve currency, still fits that bill.

The good news here is that the DXY index is nowhere its all-time high of 160 in the mid-1980s (a situation that was only resolved by 1985’s Plaza Accord, when the G5 unilaterally revalued the deutschmark, as they were then, against the US currency), let alone that 120 peak of 2002, but substantial further dollar gains could be a warning of a market dislocation of some kind.

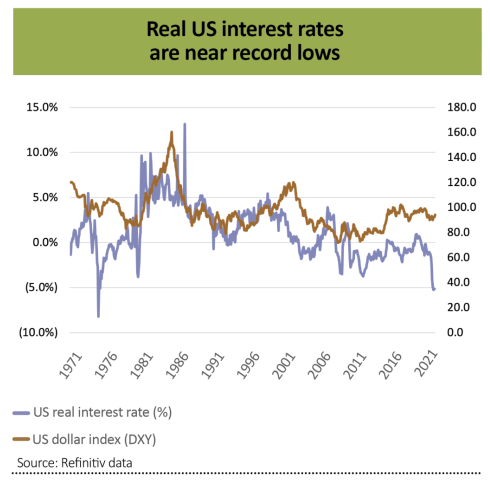
The second is US monetary policy. Whether you believe it or not, the US Federal Reserve is again discussing the prospect of tapering quantitative easing and raising interest rates in either 2022 or 2023.

Real US interest rates, adjusting for inflation, are as deeply in negative territory now as they have been for 50 years, thanks to record-low interest rates and a 5.2% inflation reading. History suggests a move upward, either due to lower inflation, higher borrowing costs or both, could boost the buck.

Yet the sensitivity of the emerging markets and commodity prices to sharp moves in the dollar suggests the Fed will have to move carefully, as the US central bank will not wish to cause – or be blamed – for the sort of upset which is now known as 2013’s taper tantrum. If monetary policy does become less loose, it seems sensible to expect higher volatility at the very least.

Please continue to utilise these blogs and expert insights to keep your own holistic view of the market up to date.

Keep safe and well

Paul Green DipFA

11/10/2021

Team No Comments

Invesco: Emerging markets, China, and the road ahead

Please see below for one of Invesco’s latest investment articles, received by us yesterday 07/07/2021:

A year and a half after the first reported cases of a new SARS-like virus in Wuhan, China, we can now look back with greater clarity on a period of some of the most dramatic volatility since the Asian and global financial crises. Here, we assess what this volatility and the associated policy responses have meant for China and emerging markets and plot a dotted line for the road ahead.

Looking up after locking down

At the time the pandemic hit, the unresolved US-China trade war loomed large and global manufacturing was in the early stages of restructuring to accommodate new trade patterns. Despite this, China stood out from other countries in terms of its fiscal, monetary and industrial policy response.

Beijing’s policy decisions focused on maintaining domestic productivity and employment with as little disruption on the demand side as possible. Manufacturers were given liberal access to capital to maintain operations, and refunds on social security tax and unemployment insurance incentivised businesses to retain staff without layoffs.

At the same time, the central bank lowered its reserve requirements and removed blocks on certain loan extensions and renewals. Investments were made in traditional infrastructure projects like housing and transportation, and spending on the nationwide 5G network was accelerated.

As a result, China moved from having a GDP contraction of almost 6% for the first quarter of 2020 to being the only major world economy to print a positive GDP growth number for the year.

A dolorous relationship?

While China’s growth in 2020 is unmatched, the road ahead is not unwinding, particularly when we consider the impact that US policy decisions could have on the US dollar.

The growth of the US fiscal balance sheet in 2020 (accommodated via easy monetary policy) appears to have stimulated real inflation in the US economy – an outcome which has led to talk of tightening. If asset purchase programmes are tapered or rates increased, the likely outcome is a stronger dollar.

Historically, a strong dollar has been negative for emerging markets, as it increases the burden of US dollar-denominated debt. This is less of a factor today than it was prior to the Asian and global financial crises. However, the fact remains that this could dampen growth prospects in some emerging market economies.

Commodities buck the trend

In spite of the observation noted above, it is likely that a stronger dollar will benefit firms selling commodities into US dollar-denominated markets, as long as there is global demand for these products. This factors into the dramatic outperformance we have seen from steelmakers, iron miners, commodity chemical companies, and even coal producers.

The demand behind this outperformance is not part of the same super-cycle seen after China’s admission to the World Trade Organisation, when investment in capacity and infrastructure facilitated the country’s transition to the so-called ‘world’s factory’.

Even when we account for the fact that some of this capacity has moved to other countries in the context of trade realignment, the overall demand for commodity materials is not in the same league as two decades ago.

Instead of a broad, sustainable growth in demand, we are seeing a short-term build-up of inventories that reflects ‘new normal’ uncertainties about tariffs and pandemic lockdowns. This goes all the way through the product cycle, from raw materials to finished goods.

Although these dynamics are almost certainly near-term and should subside in the medium-term, they do attract speculation that disrupts the market.

The road ahead

What does this disruption mean for emerging markets? In the absence of significant inflows, there is a conservation of capital within the asset class. The sharp and transitory shifts described above get funded by parts of the market that have outperformed — in this case growth companies, in particular those in China. In this sense, China has been a victim of its own success as far as its response to the pandemic is concerned, as some investors look to lock-in potential gains.

That said, in our opinion, these sharp transitions do not signify a change in the long-term view for emerging markets. The types of firms that create and capture value for shareholders remain the same.

Even with an ageing population, China remains a large economy with an outlook for sustained, high-speed growth. The growing middle class offers opportunities for investment in education, real estate services, and world-leading innovative technology platforms that facilitate consumption.

It is worth adding that the size and scale of the domestic market should make it less susceptible to external volatility than other markets in the asset class.

What these transitions offer, then, is the potential to invest in the best long-term opportunities at more attractive valuations than normal market conditions afford. 

Please continue to utilise these blogs and expert insights to keep your own holistic view of the market up to date.

Keep safe and well.

Paul Green DipFA

08/07/2021

Team No Comments

Invesco Investment Intelligence updates – 14/06/2021

Please see below for one of Invesco’s latest Investment Intelligence Updates, received by us yesterday 14/06/2021:

After April’s US CPI upside surprise, last week’s May reading was eagerly anticipated, albeit with a degree of trepidation. It didn’t disappoint. Headline CPI came in at 0.6%mom and 5%yoy, its highest level since 2008 (inflation peaked at 5.6%yoy then), while Core CPI rose even more at 0.7%mom, leaving it at 3.8%yoy, its highest since 1993. Both were 30bp above consensus expectations on a year-on-year basis. Strength was largely led by what are seen as “transitory” components, such as used cars (7.3%), car and truck rental (12.1%) and airfares (7%), even if there are other elements of consumer prices, such as shelter costs, that show more sustainable price pressures. Notwithstanding that we are probably close or at peak inflation as the impact of the lockdown starts to fall out of the calculation. How quickly and how far it will drop will be a function of whether rising costs, corporate pricing power and rising wages in a stimulus fuelled economy translate into more persistent inflation. For now, the Federal Reserve and increasing numbers of investors, witness a 10yr UST that is at its lowest level since early March, appear unconcerned about this risk. Time will tell whether this complacency is warranted or not, but it clearly remains a significant tail risk for financial markets.

Global equity markets finished the week at a fresh all-time high, with a rise of 0.6% for MSCI ACWI. It is now up 12.7% YTD. DM (0.6%) led EM (flat), with both the US and Europe ex UK hitting new all-time highs, up 13.8% and 16.7% respectively YTD, with the latter the strongest major market of the week (1.2%). Small Caps (1.3%) outperformed again, hitting new all-time highs, with DM (1.3%) ahead of EM (1.1%). It was a rare week of Tech and tech-related sector outperformance, led by IT (1.6%). HealthCare (2.8%) was the best performing sector. Real Estate also had a good week (2.1%) and is now the third best performing sector YTD, up 18.8%, behind Energy and Financials. Lower bond yields weighed on Financial sector performance, while commodity sectors also lagged. Sector performance underpinned a strong relative performance week for Growth (1.4%) versus Value (-0.3%), while Quality (1%) had a good week too. UK equities were slightly ahead (All Share 0.9%) on the back of a good week for large caps (FTSE 100 0.9%) on strength in HealthCare, Telecoms and Energy.

Government bonds had a strong week with yields pushed lower by the belief that US inflationary pressures are transitory and a dovish stance at the latest ECB meeting. 10yr USTs and Gilts fell 10bp and 8bp respectively, taking them to their lowest levels since early March. They are now down 28bp and 18bp below their YTD highs, but are still higher than their starting level, hence the negative returns YTD from the asset class. Bunds and BTPs fell 6bp and 12bp. The better tone in government bond markets supported a good week for credit markets, where IG outperformed HY globally. IG yields fell 5bp with spreads narrowing by 2bp. The latter at 91bp are within touching distance of their post-GFC low (87bp). In HY a decline of 5bp in yields took them to all-time record lows (4.54%), but spreads at 353bp remain somewhat above their post-GFC lows (311bp).

The US$ edged higher over the week with the US Dollar Index up 0.5%, its third weekly gain, leaving it up 0.7% for the year. The Euro and £ were down -0.4% and -0.3% respectively.

Commodities overall were down slightly on the week with a -0.6% loss for the Bloomberg Commodity Spot Index, which is up just under 22% YTD. Brent, up 0.9%, hit its highest level ($73) in two years. In its latest monthly report, the IEA said that OPEC+ would need to boost output to meet demand that is set to recover to pre-pandemic levels by the end of 2022. Copper was up marginally too, 0.4% on the week, after a late rally on Friday as investors bet that China’s sales of strategic reserves would have a muted impact on demand. Gold edged lower (-0.6%) as it continued to consolidate around the $1900 level.

Andy Haldane, the Bank of England’s outgoing Chief Economist, described the UK’s housing market as being “on fire” last week. Recent House Price indices from the Halifax and Nationwide, the two biggest mortgage lenders, showed annual price growth of 9.6%yoy and 10.9%yoy respectively. These were the fastest rates of growth since 2007 and 2014 respectively and a lot faster than the rates of growth (3% and 3.5% CAGR respectively) seen in the decade leading up to the pandemic, described by another senior BoE official as housing’s “Quiet Decade”. And last Thursday’s RICS House Price Net Balance reading, which measures the breadth rather than magnitude of price falls or rises over the previous 3 months, hit +83% – its highest level since the housing boom of the late 1980s. Regionally it hit +100% in the N, NW and SW of England and Wales, while London was the standout laggard at just +46%.

All in all, a very uncharacteristic housing market, which typically fall and only recover slowly in severe economic contractions. This time around a combination of factors have delivered a very different market outturn: easing of lockdown restrictions have released pent-up demand. The government has supported the market through the Stamp Duty holiday (due to finish at the end of September), although it may not be as big a motivator for moving as some think. A recent survey by Rightmove shows that it is not the biggest motivation, with only 4% saying that they would abandon purchase plans if they missed the Stamp Duty deadline. Mortgage availability has improved, particularly for first-time buyers. Borrowing costs are low. Excess savings built up during the pandemic have provided cash for larger deposits. Finally, lifestyle factors (more space, relocating from large metropolitan areas) are at play. This has created an excess of demand over supply (the gap between new buyer enquiries and new instructions in the RICS survey was the widest since 2013) and, as with any commodity, when these imbalances occur prices tend to rise.

So, will the market remain “on fire”? In the RICS survey a national net balance of +45% envisage higher prices in the short-term (3m), while a greater +64% see them higher over 12m, although prices are only seen rising between 2-3%. Halifax and Nationwide also see the potential for further price rises in the coming months as most of the current demand drivers remain in place against a backdrop of a continued shortage of properties for sale. So, the fire may rage for a bit longer. Longer-term the RICS survey sees house prices appreciating by between 4-5% over the next 5 years. A still robust market, but certainly not to the same degree that we’re seeing currently. That would be a positive outturn for the economy. 

Key economic data in the week ahead

The Federal Reserve and Bank of Japan meet this week to set their respective policy rates. Inflation data is a feature in both Japan and the UK this week, with the UK also publishing its latest employment report. In China economic activity for May is also released. Finally, there will be a number of post-G7 meetings in Europe next week, which may stir some interest, particularly those between the US and EU and Biden’s meeting with Putin.

In the US Retail Sales data for May is released on Tuesday. A decline of -0.6%mom is expected after no growth the previous month as the impact of pandemic-relief cheques faded. On Wednesday the Federal Reserve’s FOMC meets. While no change in policy is expected, market focus will be on its update of its economic projections, particularly any changes to the rates dot plot, employment and inflation projections (after two strong prints recently), as well as any clues on the future tapering of QE. Last week’s Initial Jobless Claims fell to a new pandemic low of 376k as the number of job openings has surged. On Thursday a further decline to 360k is expected.

There are a number of important data points this week in the UK. April’s Unemployment figures are published on Tuesday. A small decline to 4.7% from 4.8% is forecast. This compares to a recent high of 5.1% and 3.8% before the pandemic struck. On Wednesday May’s CPI will come out. Headline inflation is estimated to have increased 0.3%mom to 1.8%yoy mainly due to higher fuel prices. This will take inflation back to the levels seen immediately pre-pandemic. Core is also expected higher at 1.5%yoy from 1.3%yoy. So, both measures remain below the Bank of England’s 2% target. Retail Sales for May are released on Friday. After the non-essential shops re-opening bounce last month, a more sedate 1.6%mom is expected this month for sales ex Auto Fuel.

In Japan the Bank of Japan meets on Friday and is expected to keep its policy unchanged. CPI on the same day is forecast to have increased in May, but the Headline rate is still expected to be negative at -0.2%yoy, while Core is seen as flat, having fallen 0.1%yoy in April.

Chinese activity data for May is released on Wednesday. Industrial Production is forecast to have risen 9.2%yoy, slightly lower than 9.8%yoy in April. Retail Sales are also expected lower, but still strong at 14%yoy compared to 17.7%yoy in April. Fixed Asset Investment is seen up 17%yoy from 19.9%yoy last month.

There is no significant data coming from the EZ this week.

Please continue to utilise these blogs and expert insights to keep your own holistic view of the market up to date.

Keep safe and well.

Paul Green DipFA

14/06/2021

Team No Comments

Will US dollar weakness last?

Please see below for Invesco’s article regarding the US Economy, received by us late Friday 05/02/2021:

A weak US dollar is commonly seen as a benefit to international stocks as foreign companies’ returns appear more attractive in dollar-denominated terms. So it’s no surprise that, as an equity strategist, I’m often asked about my outlook for the US dollar.

After a dramatic “risk-on” rotation beginning in early 2020, we greet the new year with a technically oversold US currency and overbought stock market. In other words, investor positioning has become lopsided, arguing that a countertrend bounce in the “greenback” and near-term drawdowns in stocks may be in store.

Looking further ahead, however, I believe the “buck” should continue to depreciate for a host of reasons, and expect the current weak dollar cycle to last for years to come.

A history of US dollar cycles

The trade-weighted US dollar Index measures the value of the United States dollar relative to other major world currencies. Since the early 1970s, the relative value of the US dollar has ebbed and flowed between long and well-defined periods of strength and weakness. As illustrated in Figure 1, it seems the “greenback” is only four years into the current weak dollar cycle. On average, such cycles have lasted about eight years, the longest having been roughly 10 years.

Figure 1. It seems the “greenback” is only four years into the current weak dollar cycle

Factors that support a weak US dollar

While past dollar cycles can offer clues about what the future may hold for the currency, history isn’t enough on its own. As such, I assembled a number of other factors that I believe support a weak dollar, including:

  • Valuations suggest that a swath of international currencies are trading at substantial discounts, especially in emerging markets (EM), meaning that they may have more room to strengthen compared to the dollar.
  • The Federal Reserve remains firmly in  monetary easing mode, which means the path of least resistance seems to be downward for the US currency. If quantitative easing (QE) represents a choice between the economy and  the “greenback,” the Fed has opted to save growth and jobs by opening the spigots and inflating the monetary base at the expense of the currency. From a long-term perspective, I think it’s reasonable to expect the US dollar to weaken further should the Fed keep such an abundant supply of currency in circulation.
  • The deep economic impact of the coronavirus pandemic has necessitated counter-cyclical government support to an unprecedented degree. In turn, ballooning twin deficits have become stiff fundamental headwinds for the US dollar. Why? When the US spends more than it earns, it floods the global financial system with US dollars, placing downward pressure on the value of its currency.

My recent chartbook – Seven reasons for a weaker US dollar and stronger international stocks – takes a deeper dive into these factors, as well as other reasons why I believe we may only be halfway through the current weak US dollar cycle.

Investment implications

In a global context, currency dynamics are an important component of investors’ total returns. For example, EM currency strength (the flipside of US dollar weakness) has boosted dollar-based investors’ returns on EM stocks (priced in US dollars).

Why have EM stocks moved in the same direction as their currencies? It’s a virtuous, self-reinforcing “flow” argument. Before foreign capital can flow into EM stocks, foreign currency-denominated assets must be sold in exchange for EM currencies.

Apparently, improving fundamentals versus 2015/16 have made the emerging market economies a more attractive destination for foreign capital, and the Fed’s dovishness is helping the situation.

For investors, this isn’t just an EM story. It’s a bigger message — one that I believe has positive ramifications for international stocks more broadly.

Learning about major players in the markets such as the US and their effect on the global markets as a whole can be useful and keep your holistic view of the markets up to date.

Please continue to check our blogs section for articles like these.

Keep safe and well.

Paul Green