Team No Comments

The economic outlook improves, but the shadow of COVID lingers

Please see below article received from Invesco yesterday afternoon, which conveys a positive outlook for the global economy despite concerns over a ‘fourth wave’ in countries such as Brazil and India.

IMF upgraded its economic outlook

The International Monetary Fund (IMF) provided a press briefing last week, sharing recent alterations to its global economic outlook for this year. The IMF now expects the global economy to grow 6% in 2021 — the highest level of growth since 1980.1 This is an upward revision from its previous estimate in October of 5.5% growth in 2021 for the global economy.

This is a reflection of the optimism created by the discovery and rollout of effective vaccines as well as significant fiscal stimulus, which is already having a positive impact on some countries such as the United States. It dramatically revised its growth expectations for the US economy in 2021 from 5.1% to 6.4%.1 The IMF modestly upgraded its expectations for economic growth in China in 2021 from 8.1% to 8.4%.1 One key takeaway from the IMF’s press briefing is that the world is on divergent recovery paths. The US and China, the two largest economies in the world, are leading the recovery, but other countries are experiencing a far slower recovery and are not expected to reach pre-pandemic GDP levels until 2023.

Eurozone PMIs point to improvement

The final eurozone composite Purchasing Managers’ Index (PMI) reading for March was 52.5 versus 48.8 for February.2 More importantly was the final services PMI reading for March: 49.6 versus 45.7 in February.2 We saw significant improvement in a number of countries including Ireland, the UK, and Germany. And so while it’s no surprise to me that manufacturing continues to strengthen, led by manufacturing powerhouse Germany, it is surprising — and encouraging — to see the services sector improving in some countries despite rising COVID-19 infections and lockdowns.

Chris Williamson of IHS Markit explained what is happening in the euro area: “The survey therefore indicates that the economy has weathered recent lockdowns far better than many had expected, thanks to resurgent manufacturing growth and signs that social distancing and mobility restrictions are having far less of an impact on service sector businesses than seen this time last year. This resilience suggests not only that companies and their customers are looking ahead to better times, but have also increasingly adapted to life with the virus.”2

This is good news, given that the vaccine rollout in the eurozone has been disappointing. While I don’t expect a robust recovery until COVID-19 is well controlled, the PMI readings suggest the economy can still recover in an environment of slow vaccinations and higher stringency.

FOMC minutes represent a ‘have your cake and eat it too’ moment

The Federal Reserve upgraded its economic outlook — but that didn’t change its stance on accommodative monetary policy. The minutes from the March meeting of the Federal Open Market Committee (FOMC) were released last week, showing that its growth expectations for the US economy in 2021 were — similar to the IMF — upwardly revised to 6.5% from 4.2%, while unemployment expectations were revised down to 4.5% for 2021 from 5%.3 The Fed’s optimism was driven by the economic re-opening and increased fiscal stimulus. The Fed also upwardly revised its expectations for inflation, forecasting 2021 core personal consumption expenditures to increase by 2.2% — this is a substantial increase from its previous forecast of 1.8%.3

In my view, these minutes represent a “have your cake and eat it too” moment — a Fed that expects the economy to experience strong growth — but will not pre-emptively tighten as it has often done in the past. The Fed is expecting a brighter economic outlook, but wants to remain very accommodative. The minutes stated that it will be “some time before the conditions are met for scaling back the asset purchase program” — and the Fed still expects rates to remain zero through 2023.3 In these minutes, the Fed once again reiterated its plans to sit on its hands well beyond 2021, anticipating that the spike in inflation it expects this year will be transitory. Investors couldn’t ask for a nicer Fed.

We heard lots of ‘Fedspeak’

We didn’t just get the minutes from the March FOMC meeting last week. We also heard from various Fed officials. Here are the highlights:

  • Last week Fed Chair Jay Powell suggested that COVID-19 infections are the biggest risk to the economy. He shared a cautionary message about the pandemic last week despite growing optimism about the economy: “Cases are moving back up here, so I would just urge that people do get vaccinated and continue socially distancing. We don’t want to get another outbreak; even if it might have less economic damage and kill fewer people, it’ll slow down the recovery.”4
  • St. Louis Fed President James Bullard shared his view that the Fed should not even consider any changes to its monetary policy until we have certainty that the pandemic is over. In my view, this could further delay monetary policy normalization given that it could tether future Fed considerations to health-related accomplishments.
  • Then, last night, Powell appeared on an American TV news show, “60 Minutes.” He reiterated that the principal risk to the economy is a resurgence of the pandemic. Powell stated that the US is “at an inflection point,” and he expects growth to be very strong in the back half of 2021. One important line from his interview, “The Fed will do everything we can to support the economy for as long as it takes to complete the recovery.”5

Signs of inflation in PPIs

The US Producer Price Index (PPI) rose substantially in March, exceeding expectations. However, markets barely flinched. And this rise in PPI is not specific to the US; China also experienced a big rise in producer prices. My view is that these data points are to be expected, a combination of base effects and short-term supply disruptions. However, that doesn’t mean we won’t want to follow future inflation data closely, including US Consumer Price Index this week.

Fears of a ‘fourth wave’ continue

The Fed’s concerns about COVID-19 are well-founded. COVID-19 cases are on the rise in a number of countries, most notably Brazil and India. Bruce Aylward, a World Health Organization official, described the situation in Brazil in stark terms, “What you are dealing with here is a raging inferno of an outbreak.”6 I believe concerns about infections, especially a rise in the spread of more contagious variants, will continue to be an intermittent cause of concern for markets.

So what happened in markets?

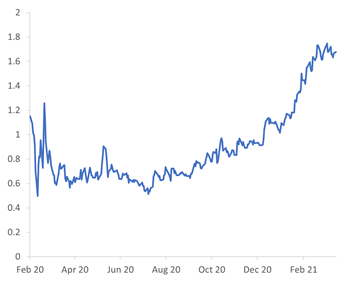
The big news is that the yield on the 10-year US Treasury backed down materially last week. This came as a surprise to many, given that the outlook for the economy continues to improve — as have expectations for inflation.

I think there are several possible reasons for this.  First of all, it could be a reaction to rising COVID-19 infections in parts of the world, which could be causing investors to actually lower expectations for growth. Similarly, all this talk of rising taxes in the US could also be dampening expectations about a very strong economic recovery. Or perhaps investors are finally starting to believe the Fed when it says it will not be tightening any time soon.

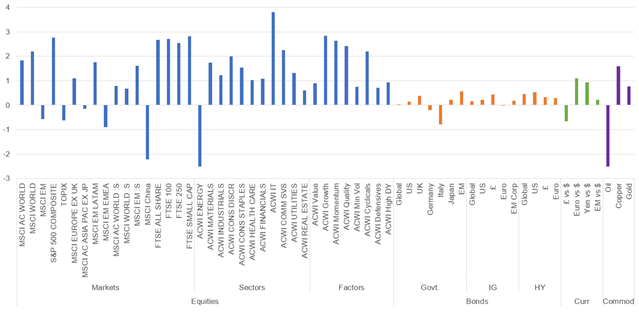
Not surprisingly, because yields backed down, there was a rotation within stocks. Stocks in general made gains last week, but technology stocks and other more growth-oriented stocks — as well as larger-cap stocks — assumed positions of leadership. Going forward, I would expect a continuation of this trend: rotations in leadership tied to changes in the 10-year yield. But make no mistake — I am in the camp that expects yields to rise this year. Despite last week’s downward moves, I expect the yield on the 10-year US Treasury to reach 2% or higher this year.

Looking ahead

There is a lot to look forward to in the coming week, from US retail sales to UK gross domestic product (GDP) to the business outlook survey from the Bank of Canada. Here are a few items I am focused on:

  • Eurozone retail sales. The services PMIs mentioned previously suggest that the pandemic and lockdowns don’t seem to be having as big an effect on the service sector of the economy. This data should help confirm that theory.
  • Beige Book. The Fed’s “Beige Book” is chock full of anecdotal information from businesses in the different Fed districts across the country. It gives you a real sense of what they are experiencing — and thinking about.
  • China GDP. China has clearly helped lead the economic recovery in the early innings. This will give us a sense of how strong that leadership has been in the last quarter, and what parts of the economy it has come from.
  • Earnings season. Earnings season begins this week. Many companies abandoned guidance in the midst of the pandemic, but I am hopeful we will get more guidance this quarter. Any kind of outlook will be valuable.
  • Global vaccination levels. As always, I remain most concerned about our ability to control the pandemic, and the speed with which we vaccinate populations plays a critical role. As Fed Chair Powell has made clear, he believes the pandemic is the greatest risk to the economy this year. When I went to receive my second COVID-19 vaccine yesterday, the physician’s assistant who inoculated me ominously warned me against laminating my vaccination card. She matter-of-factly explained, “You will be back periodically for boosters. This is not over.” That’s because variants are spreading, especially where COVID-19 hasn’t been controlled, and will likely make it quickly to other parts of the world. There is a funny expression in the US about the city perhaps best known for gambling and general fun that is arguably more decadent: “What happens in Vegas, stays in Vegas.” But there is no such thing when it comes to a pandemic. What happens in Sao Paolo (or New Delhi or Paris or Amsterdam or Los Angeles) doesn’t stay there. It can happen everywhere. So we need to care about vaccinations everywhere.

Please check in again with us soon for further market updates and news.

Stay safe.

Chloe

15/04/2021

Team No Comments

Brewin Dolphin – Markets in a Minute

Please see below this week’s Markets in a Minute update from Brewin Dolphin – received late yesterday afternoon – 13/04/2021

Equities hit new highs on hopes of sustained economic recovery

Numerous share markets hit all-time highs last week, with the S&P500 bursting further past the 4,000 mark, finishing the week comfortably in record territory at 4,129. European markets also performed strongly, as investors bet on continental economies reopening later this year despite problems with the vaccination programme. The European Stoxx600 hit a record high of 437.23 on Friday.

In the UK, confidence in the continued easing of restrictions helped the FTSE100 rally by more than 2.6%, to levels not seen since before the pandemic. Meanwhile, the more domestically focused FTSE250 surged through its previous record of 22,000.

The tech-heavy Nasdaq also recouped some of its recent losses last week, rising more than 3%, helped by a pause in rebounding bond yields. Asia was more subdued, however. Chinese policymakers are reportedly considering tightening monetary and fiscal policy to prevent the economy overheating and inflation rising too high, leading to a pullback in share prices.

Last week’s market performance*

  • FTSE 100: +2.64%
  • Dow Jones +1.95%
  • S&P 500: +2.70%
  • Nasdaq: +3.11%
  • Dax: +0.84%
  • Hang Seng: -0.82%
  • Shanghai Composite: -0.45%
  • Nikkei: +1.29%

*Data from close of business on Thursday 1st April to close of business Friday 9th April.

Shares start week on cautious note

Markets edged back from their record highs on Monday, as investors digested last week’s surge in equity markets, and looked ahead to key US inflation data out later today. It is the start of first-quarter earnings season in the US this week.

In the UK, the FTSE100 closed down 0.39% at 6,889, despite the feelgood factor accompanying the reopening of non-essential shops and pubs.

In the US, the Dow fell 0.16% at 33,745.40, while the S&P500 fell slightly, losing 0.02% to close at 4,127.99 and snapping a three-week winning run in the process. The Nasdaq fell by 0.36%. In Europe, the Stoxx600 index dropped by 0.25%, although markets in France and Germany edged up.

Bond yields take a breather

The yield on 10yr US treasuries started the year below 1%, but surged in the first quarter to hit 1.67%. Rising treasury yields are usually a sign of increasing investor confidence since yields move inversely to bond prices. When investors sell bonds and invest more of their portfolios in risk assets such as equities, yields rise.

However, there can come a point at which higher yields can tempt investors back into bonds to enjoy a risk-free return on their money, or to search for sectors with more upside potential, especially if yields rise too fast.

Hence, we have seen a large-scale rotation out of growth stocks and into more value-orientated, cyclical sectors during the first quarter, as evidenced by the recent correction in big tech in the US.

The pause in rising yields last week was a key factor in the strong performance in share markets over the past few days, particularly on the Nasdaq.

While yields will likely continue to rise, with 10yr treasury yields expected to hit 2% by the end of 2021, the increase is expected to be more gradual, which equity markets should find easier to digest.

US 10yr Treasury yield

Source: Refinitiv Datastream

Global growth set for record year

The International Monetary Fund (IMF) said last week that it expects the global economy to grow by 6% this year, up from the 5.5% it forecast in January.

If true it will be the fastest expansion on records going back to 1980, despite large parts of the world still being mired in the pandemic.

Also supporting the bullish outlook are the trillions in excess savings waiting to be spent around the world, an improving employment picture in the US, and the Federal Reserve’s insistence that it will not be rushed into raising rates until there is solid evidence of a sustained recovery. Minutes from the last Federal Reserve meeting suggest that there is no intention to raise interest rates until at least 2024, and even then would require firm evidence of a sustained economic recovery and inflation at or above its 2% target.

All this should support further growth in equities as long as we don’t get a nasty overshoot in inflation, and bond yields remain relatively stable.

UK economic recovery appears on track

Last week we saw a slew of positive economic data that suggests the UK economy is enjoying a healthy rebound. The ISM/Markit Purchasing Managers’ Index for the key UK services sector, which accounts for around 80% of GDP, showed business levels improving for the first time since last October, with 56.3% of respondents reporting higher business volumes in March than in February. The UK construction industry is also recovering strongly, with the construction activity index hitting a reading of 61.7, its highest level in seven years.

Another quick update from Brewin Dolphin, these updates are a good way of keeping up to speed with developments in the markets.

Please continue to check back for our latest blog posts and market updates.

Charlotte Ennis

14/04/2021

Team No Comments

The Changing of The Weather

Please see the below article from Legal and General’s Asset Allocation team received late yesterday afternoon:

With some of the lockdown rules easing in England today, and following some recent warm and sunny weather, it feels like change is in the air. In this week’s Key Beliefs, we look at three areas of the market where change may also be on the way.

A deluge of EU doses?

We try not to talk too much about the vaccines and virus now, as it’s increasingly important we focus on other factors. That said, vaccines have featured more heavily in our recent debates and in the market’s commentary.

In the UK, about 60% of adults have had their first jab. In the US, it’s nearly 50% and 25% of adults are fully vaccinated. While there are still risks to reopening in both cases, the likelihood is that the vaccinations will win out in the race against another viral wave.

Inevitably then, there’s a lot of attention on the European Union, where only about 25% of adults have received their initial vaccine dose. It was inevitable that the more infectious variant that was first identified in the UK would become the dominant strain across the continent, and unfortunately that’s led to further lockdowns, so the question is when Europe will be able to reopen.

The good news is that despite the disappointing progress so far, the EU is poised to accelerate rapidly and will likely be two months or fewer behind on its journey. Alongside some more surprising stories, like Bavaria buying the Sputnik V vaccine, the past fortnight has brought the highest vaccination rates yet at 1.5-2% a week. Germany has now outlined its potential to vaccinate 12.5% of its population a week once the supplies are available; Martin Dietz estimates German deliveries at 16.6 million doses in April across four different vaccine providers.

To catch the US up over two months, the EU would need to vaccinate about 4.5% of the population a week. Given the diversified sources of supply Europe is employing, that looks very achievable. So, on balance, Europe could be another source of positive surprises this quarter. We believe this is supportive of both our travel and leisure equity position and broader positive equity view.

High and dry

Market activity tends to be low in the week following Easter, and similarly there was just one view change from our team last week. That came in US Treasuries, where we removed the tactical short position that was designed to help protect us from the risk of a bumper employment number on Good Friday.

After nearly a million US jobs were added in March, we expect further good news as the country reopens. While that supports our medium-term positive equity view, we’re not convinced it implies higher bond yields. There are two main reasons why.

First, with a 10-year yield around 1.65%, we think valuations are towards the upper end of a fair range and that markets will struggle to price in a much higher path, with almost four rate hikes implied in the market consensus by the end of 2023.

Second, we know being short US Treasuries is a very popular position; we try to avoid such crowds, so we prefer to keep our powder dry.

The biggest risk to yields in the coming months may be the upcoming inflation numbers. Starting from depressed levels this time last year, economists already expect temporarily high prints in the second quarter.

However, with so many unusual factors – including the large build-up of household savings – there is a chance that there are big surprises. Last week, we saw the Producer Price Index rise 1% against a consensus expectation of 0.5%. While it’s a noisy series, it could be the first of many.

That said, for the longer term we don’t buy into the idea that there’ll be sustained inflation and are prepared to look through the short-term noise.

The calm after the storm

Uncertainty is high this year, which makes our mantra of ‘prepare, don’t predict’ all the more important. To take one example, sentiment towards equities has been positive for most of the year, but not stretched to levels where it becomes a worrying sign.

However, one of the indicators that Lars Kreckel finds most reliable, the AAII Bull-Bear Spread, has now jumped to 36.5 and is close to the 40+ level that he considers a warning signal. The most recent Goldman Sachs QuickPoll suggests sentiment is a lot less elevated, though.

Against the improving backdrop, we’ve also seen implied volatility in equities drop markedly over the past couple of weeks, with the VIX at its lowest level since February 2020 and broadly in line with average levels from 2018-2019.

So with some evidence that investors are becoming more bullish, we retain our positive equity view, although following strong performance we rebalance to avoid weights drifting up further. Some portfolios have also been selling volatility at elevated levels as a source of return, but we expect those opportunities will be increasingly hard to find.

Please keep checking back for our regularly updated blog content covering a range of market updates and insights from a number of great fund managers, as well as topical issues such as ESG and our own thoughts and input.

Andrew Lloyd

13/04/2021

Team No Comments

Investment Intelligence Update – Weekly Market Performance

Please see below commentary received from Invesco this morning, which analyses market performance over the past week – as the IMF predicts strong economic recovery this year.

The IMF’s latest World Economic Outlook, published last week, reaffirmed the forecasting community’s expectation of a strong economic recovery in 2021. The rollout of multiple vaccines, better than expected adaption to pandemic life, additional fiscal support in some countries, particularly the US, and continuing monetary accommodation (the Fed reaffirmed during the week that the bar for tapering asset purchases, the first stage in tightening policy, remains high) underpinned the IMF’s 50bp upgrade to 2021 forecasts, from an already strong 5.5% to 6%. However, the IMF continues to expect that differences in the pace of the vaccine rollout, the extent of policy support and structural factors, such as the reliance on tourism, will ensure any recovery will be a multi-speed one. The US leads the way among advanced economies (see chart of the week) and is forecast to surpass its pre-Covid GDP levels this year, while many others (including the UK) won’t do so until 2022. It’s a similar picture in emerging economies, where China already returned to pre-Covid levels in 2020, but many others are not expected to do so until 2023.

While global equities had a good week overall (MSCI ACWI 1.8%), hitting a new all-time high, not all markets made gains. While DM were up 2.2%, EM continued to struggle, falling 0.6%, led lower by Asia (EM Asia -0.8%). EM are now over 7% below their 12.5% YTD high and are around 4.5% behind DM. As markets have rallied, expectations of future volatility have declined, with the VIX dropping to below 17 for the first time since pre-pandemic, but that remains well above the historical lows (<10) of the late 2010s.  DM performance was led by US equities, with the S&P 500 up just under 3% and hitting a new all-time high. Europe also made gains and is the strongest DM region YTD (MSCI Europe ex UK 10.4%). While Small Caps underperformed (0.8%) they remain well ahead of the overall market YTD. EM and DM small caps have risen broadly in-line. At a sector level, tech-related sectors dominated performance, with IT (3.8%) and Communication Services (2.3%) leading the way. Energy (-2.5%) struggled against a weaker oil price, although remains the best performing sector YTD. In a risk-on environment, defensive sectors underperformed and remain the market laggards. Consumer Staples and HealthCare are only up 2-3% YTD. It was a rare week of Growth (2.8%) outperformance against Value (0.9%). Momentum (2.6%) and Quality (2.4%) also performed well. UK equities outperformed (All Share +2.8%), with both mid and small caps hitting new all-time highs. A weaker £ and an easing of lockdown measures underpinned the market.

Government bond yields were relatively stable, with 10yr USTs, Gilts and JGBs seeing 1-2bp declines. There was modest upward pressure in EZ yields with the 10yr Bund and BTP up 3bp and 11bp respectively. Overall global government bonds are still down YTD (-2.9%), with Gilts and USTs the main laggards. Credit yields and spreads edged lower in both IG and HY, with the latter outperforming (0.5% vs 0.2%). HY is comfortably ahead YTD (1.3% vs -2.7%) with the EZ the best of the regional markets in both IG and HY.

The US$ gave up some of its recent gains with the US Dollar Index down 0.9%, its worst week since December, as both the Euro (1.1%) and Yen (0.9%) appreciated. £ was an outlier, declining 0.7% and back close to its YTD lows at just over $1.37.

After a strong start to the year (up 34% at one point), oil prices have struggled in recent weeks and gave up 2.5% last week as virus-related demand concerns remained and OPEC+ decided to increase supply between May and June by 2mbd. Although it saw a small gain, Copper has struggled to regain momentum since reaching a 9-year high in February as demand concerns, a stronger US$ and rising inventories have weighed on sentiment. Gold (0.8%) has bounced off its lows as a stabilisation in real yields and a weaker US$ have provided some support. It is still down 8% YTD.

Market performance last week (%)

Past performance is not a guide to future returns. Sources: Datastream as at 11 April 2021. See important information for details of the indices used.

YTD market performance (%)

Past performance is not a guide to future returns. Sources: Datastream as at 11 April 2021. See important information for details of the indices used.

Chart of the week: ISM Services PMI Index and S&P 500 performance

Past performance is not a guide to future returns. Source: Datastream as at 12 April 2021. Price only performance.

  • There have been a series of much stronger than expected US economic data releases since the start of April. These include the ISM Manufacturing PMI, that hit its highest level since December 1983, and Non-Farm Payrolls that at 916k came in much better than expected (albeit seasonal effects probably overstated the degree of the beat). Last Monday we saw the ISM Services PMI hit an all-time high of 63.7, rising from 55.3 and well ahead of consensus expectations of 59 (remember here that PMIs are diffusion indices, so tell us the percentage of firms that are experiencing an uptick in business and do not give a sense of the magnitude). While the Services PMI has a much shorter history (since 1997) than the Manufacturing PMI (since 1948), it remains a key guide to business sentiment in what is, of course, the dominant sector in the US economy.
  • And as the chart highlights there has historically been a close relationship between equity market performance and the Services PMI. The correlation is a high 64%, only marginally lower than the 67% correlation with the Manufacturing PMI over the same time period. Given this relationship and the strength of the Services (and Manufacturing) recovery from the pandemic lows, its hardly a surprise that the equity market performance has been so strong.
  • Clearly there is a big surge in activity under way as the weather improves. Alongside that, although new cases have picked up recently, the substantial drop in virus case numbers from the second wave peak and the successful rollout of the vaccination programme (34% have received their first shot) has allowed lockdown restrictions to be lifted at the same time as Biden’s $1.9trn in additional fiscal stimulus boosts incomes. And the improvement in the PMI has been broad-based, with all eighteen industries reporting growth. Among the key sub-components of the index the largest gains were seen in Business Expectations (+13.9pts to 69.4) and New Orders (+15.3pts to 67.2), both at record levels. Employment also saw an improvement, reflecting the strong Non-Farm Payrolls numbers, and at 57.2 is back at pre-pandemic levels.
  • For those concerned about a potential lift-off in inflation, there were further signs that inflation pressures continue to rise. The Prices index rose to 74, its highest level since 2008, a similar picture to what we saw with Manufacturing (85.6). Time will tell whether that turns into a sustained and/or substantial rise in inflation, forcing a change in policy stance from the Federal Reserve. For now, the Federal Reserve thinks not. The risk is that they are wrong.

Key economic data in the week ahead

  • A relatively quiet week ahead with China’s Q1 GDP and US inflation the main features.
  • In the US March’s Inflation data is out on Tuesday. Headline and Core are expected to rise 0.5%mom and 0.2%mom respectively. This would take them to 2.5%yoy and 1.6%yoy, the former the highest it has been since before the pandemic. Initial Jobless Claims posted a surprise uptick last week to 744k. It is expected to drop to 700k on Thursday – still elevated given the strength of the economic recovery. On the same day Retail Sales for March are also forecast to jump thanks to the latest round of stimulus cheques and improved weather. An increase of 5.5%mom is pencilled in following the 3% drop in February. Following the recent batch of positive economic data, the University of Michigan Consumer Sentiment index for April on Friday is expected to rise to 89 from 84.9, the highest reading since March of last year.
  • The only data point of note in the UK is February’s monthly GDP published on Tuesday. Although economic activity is expected to have picked up, increasing 0.5%mom after January’s 2.9% contraction, the rolling 3m number is expected to remain negative at -1.9%. Improvement in services is the key driver here, with February forecast at 0.5%mom after the 3.5%mom fall in January.
  • In the EZ Retail Sales data for February is released on Monday. A small 1.3%mom gain is forecast, but still leaving a -5.4%yoy shortfall. February’s Industrial Production numbers are released on Wednesday. A -1%mom decline is expected, leaving it at -1%yoy.
  • In China Q1 GDP is published on Friday. A quarterly gain of 1.4%qoq is forecast, leaving the economy higher by 18.3%yoy. The increase in economic activity is expected to be broad based, with Industrial Production, Retail Sales and Exports forecast to rise 27.6%yoy, 28%yoy and 28%yoy respectively.
  • There is no data release of significance from Japan this week.

We will continue to publish relevant market analysis and news as we enter the 10-week countdown to the end of the UK’s national lockdown.

Stay safe.

Chloe

12/04/2021

Team No Comments

Will ‘peak pension freedoms season’ return after pandemic-induced withdrawals slump in 2020?

This email was received yesterday, 11/04/2021, and this article was written by Tom Selby, a Senior Analyst at A. J. Bell.

Until 2020, the beginning of a new tax year has traditionally been peak pension withdrawal season, with UK savers taking advantage of a fresh set of tax allowances to access larger amounts from their retirement pots.

In fact, before the pandemic hit withdrawals in the first three months of the financial year had been between 10% and 33% higher than in subsequent quarters.

That all changed last year, when retirement income investors spooked by the uncertainty of lockdown – not to mention double-digit market falls – tightened their belts, with year-on-year withdrawals dropping 17%.

This likely reflected people choosing to either delay accessing their pension, pause withdrawals or reduce the amount they were taking as income in the face of profound uncertainty.

While most of us still have fewer things to spend our money on at the moment – particularly given restrictions on foreign travel – the success of the coronavirus vaccine and more stable market conditions mean we should expect to see a significant jump in withdrawals in the coming quarter.

For those accessing their retirement pot during this period, there are various pitfalls and bear traps to watch out for.

Source: HMRC

1. Taking taxable income flexibly from your pension will trigger an irreversible £36,000 cut in your annual allowance

Anyone considering taking taxable income from their retirement pot for the first time needs to be aware of the severe impact it will have on their ability to save tax efficiently in a pension in the future.

Taking even £1 of taxable income will trigger the money purchase annual allowance (MPAA), reducing the amount most people can save in a pension each year from £40,000 to just £4,000.

Furthermore, if you trigger the MPAA you will lose the ability to ‘carry forward’ unused pensions allowances from up to 3 previous tax years, meaning in some cases the impact will be a £156,000 reduction in the potential annual allowance in the current tax year, from £160,000 to £4,000.

To avoid an annual allowance cut, savers who have the option should consider using money held in vehicles such as ISAs or cash savings accounts first. For those who only have their pension, just taking your 25% tax-free cash will also allow you to retain the £40,000 annual allowance.

2. Your first taxable withdrawal will be subject to emergency ‘Month 1’ taxation

Since the pension freedoms launched in April 2015, around £700 million has been repaid to savers who were overtaxed on taxable withdrawals.

When you first take a flexible payment from your pension, HMRC will automatically tax it on an emergency ‘Month 1’ basis. This means that the usual tax allowances are divided by 12 and then applied to that first withdrawal.

For example, if someone made a £12,500 taxable withdrawal in 2020/21 and had no other taxable income, they might expect to be charged 0% income tax as the withdrawal is within their personal allowance.

However, because it is their first taxable withdrawal only £1,042 (£12,500 personal allowance divided by 12) is taxed at 0%. The next £3,125 (£37,500 basic-rate tax band divided by 12) is taxed at 20%, with the remaining £8,333 taxed at 40%.

In total, rather than paying zero tax they would face an initial – potentially shocking – bill of £3,958.

For those taking a regular income this shouldn’t be a problem, as any overpaid tax in the first month will be ironed out via your tax code. However, where it is a single payment over the tax year there are two options – wait until the end of the tax year for HMRC to hopefully sort it out, or sort it out yourself by filling out one of three forms.

Once you’ve filled out and sent off the relevant form, HMRC says you should receive a refund of your overpaid tax within 30 days.

View the tax refund form

  • If the withdrawal used up your entire pension pot and you have no other income in the tax year, use form P50Z;
  • If the withdrawal used up your entire pension pot and you have other taxable income, use form P53Z;
  • If the withdrawal didn’t use up your pension pot and you’re not taking regular payments, use form P55.

3. Think about the sustainability of your retirement plan – and beware big withdrawals during falling markets

Last year saw the first bear market – characterised by falls in stocks of more than 20% – since the pension freedoms launched in 2015. The pandemic and global economic shutdown brought into sharp focus the importance of understanding the investment risks you are taking and managing withdrawals sustainably.

This is particularly the case where large withdrawals come at the same time as big falls in markets, a phenomenon often referred to as ‘pound-cost ravaging’.

As an example, someone taking a 5% inflation-adjusted income from their fund who suffered a 20% hit in their first year of drawdown and 4% growth thereafter could see their pot run out after 18 years – three years sooner than if they suffered the hit 10 years into retirement.

To put this into context, whilst on average life expectancy at 65 is 18.6 years for men and 21 years for women, a man has a 1 in 4 chance of living another 27 years, while a woman has a 1 in 4 chance of living another 29 years.

Savers wanting to manage withdrawals sustainably and avoid selling down their capital at a low point in the market could use other cash resources – such as ISAs, savings or their 25% tax-free cash – in order to keep their underlying pension intact.

Taking a natural income has also been a good strategy previously, although finding companies paying the dividends needed has been a real challenge over the past 12 months.

For those who do take capital withdrawals from their pension, the key is to have a plan in place and review your income strategy regularly, ideally with the help of a regulated adviser, to ensure you aren’t risking running out of money early in retirement.

4. If you’re just taking your tax-free cash, don’t forget about the remaining 75% of your fund

The vast majority of savers cite accessing their 25% tax-free cash as the main reason for entering drawdown*. This is understandable given this is one of the main tax benefits of saving in a pension.

Although accessing your tax-free cash won’t necessarily mean a change in your underlying investments, it is worth using this as an opportunity to review your retirement plans and ultimate goals.

For example, someone planning to take a regular income after accessing their tax-free cash will likely have a different asset allocation to someone who doesn’t plan to touch the remaining money for 15 years.

While many will understandably be spooked at the prospect of investing at the moment, it is worth remembering that short-term volatility has historically been the price you pay to enjoy longer-term growth.

Investors also need to be aware of and comfortable with the risks they are taking.

Although investments can go down in value as well as up, the value of cash will be eaten away by inflation over time.

5. Do you want to spend your pension or leave it to loved ones after you die?

Pensions are no longer just about providing an income in retirement. Since 2016, savers have been able to pass on leftover pensions tax-free if they die before age 75.

Where the pension holder dies after age 75, the remaining funds will be taxed at their recipient’s marginal rate when they make a withdrawal.

For those who want to leave assets to loved ones, it therefore often makes sense to leave as much of your pension untouched as possible in order to minimise your tax bill.

This means when you come to flexibly access your pension for the first time, you should think not just of your retirement income strategy but also your IHT plans.

It’s also important to ensure your nominated beneficiaries are up-to-date so the right people inherit your pot.

Useful input from Tom at A. J. Bell.  There is nothing new here, since the new ‘Pension Freedoms’ were introduced in April 2015 we have had the freedom to withdraw capital and/or income from age 55 from our fund value based pension pots with greater flexibility.

However, we have had some form of Pension ‘Drawdown’ legislation in place since 1995.

This is a key area for independent financial advice.  The pitfalls are substantial if you don’t fully understand what you are doing.

In general terms, it’s probably better for the majority of the population not to access their pension funds until they retire or at least semi retire.  There are exceptions to this.

My focus as an IFA is in the following areas:

  1. Overall tax efficiency, holistically and with your partner if applicable
  2. Sustaining your pension assets for potentially a long-term retirement.  We are living longer on average
  3. Retaining your ability to fund pensions at a good level if at all possible
  4. Building your assets for your eventual full retirement, a variety of assets to aid tax efficiency and risk control

Retirement planning is not a ‘one size fits all’ approach.  We need to carefully take into account our client’s circumstances, plans and objectives.

The earlier you start planning for retirement the better.  We can do a lot more with a 15 year term to retirement than we can with a few months.  However, even if you are coming to this ‘Pension Freedom’ late, near drawing benefits, please do take advice.

Steve Speed

12/04/2021

Team No Comments

The Silicon Valley of Green Tech?

Please see the below article from Invesco:

The health crisis of 2020 created a synchronised economic depression requiring equally radical policy responses.

Europe’s response was the creation of a €750bn European Recovery Fund. However, rather than just deploy the capital, member states chose to focus on a Green Recovery and hence use the funds to address the existential threat of climate change. In practice this means the European Commission spending is being guided by the newly developed sustainable finance taxonomy. Promoting activities supportive of the environmental objectives of climate change mitigation and adaption:

  • Sustainable use and protection of water and marine resources
  • Transition to a circular economy
  • Pollution prevention and protection of biodiversity and ecosystems
  • It also contains criteria that ensure activities ‘do no significant harm’

European environmental legislation is not new. For years Europe has been a first mover in safety standards and best practices that become global standards, however, the European Green Deal marks a more dynamic approach. Taxonomy is the means by which the market will administer the carrot or the stick to companies. Winners will be those seen to solve the environmental crisis and losers will be those thought to be the cause.

This comes at a time of other changes to the investment landscape. Savers now demand their asset managers embed sustainability into allocation decisions. Fund regulation is playing its role too, through the deployment of SFDR this year, funds will be classified dependant on embedding ESG principles thereby making it easier for savers to pick compliant funds and avoid others. Lastly, the pandemic has created the political cover to deploy the significant European Recovery Fund to sustainable companies.

Combined these elements create the foundations for success. European companies that comply with taxonomy will see their cost of capital fall vs those that don’t.

The EU Recovery Plan is interlocked with the Commissions’ 2019-24 priorities that included the realisation that “Europe needs a new growth strategy that will transform the Union into a modern, resource efficient and competitive economy”. This is an inclusive plan with The Just Transmission Mechanism’s goal that ‘no person or place left behind’. At least E150bn is being made available to address socio-economic effects of the transition out to 2027 – a topic we discuss in greater detail in another piece (link to The Just Transition article). However, the real prize isn’t intra-Europe it’s global.

The goal of climate neutrality requires significant investment and innovation. If the transition is effective through taxonomy rewarding companies in the transition phase, we will grant our existing enterprises a competitive advantage though access to the cheapest capital. This will create more dynamism through more innovation and the creation of products, services and refreshed skilled jobs to achieve all the EU goals. Brown companies can become Green.

This idea of creating a pathway isn’t new. Europe has 2030 targets not just 2050, including transition plans for hybrid ahead of full electric vehicles, coal to gas electricity generation and developing blue hydrogen ahead of green hydrogen being viable. Through this approach we can incentivise European companies to allocate their existing cashflow towards green innovation as opposed to being forced into ever larger dividend yields.

Silicon Valley is perhaps the best example of the prize on offer. The birth of Silicon Valley was a confluence of skilled science-based research, education, venture capital and defence spending, particularly through the creation of NASA and the space race. The success and longevity of which is a function of being the first and with it a sustainable multiplier effect.

We are already starting to see the positive effects from this focus on transition. European oil companies lead the way in reallocating hydrocarbon cashflows towards greener alternatives (Total, Repsol, BP). In renewable energy, Europe is home to the leading wind turbine manufactures (Vestas, Nordex and Siemens Gamesa) and our power generators are world leaders in green production (Enel, EDP, Acciona). In technology, European semiconductor companies have leadership in Auto electrification (Infineon and STMicro). We also have expertise in building materials and renovation focused on reducing energy consumption (SaintGobain, Wienerberger, Kingspan). Europe’s paper companies are transitioning to sustainable packaging and biofuels (UPM) and Europe is home to worldwide leaders in the circular economy (Veolia and Suez). All are stocks that are held in portfolios across the team, to a varying degree.

Europe has grand ambitions and a once in a generational opportunity to steal a march on other continents through early adoption of regulation and technology. Through incentivising companies to innovate and embrace climate change Europe can become a global exporter of Greentech products and services to the rest of the world and enjoy the multiplier effect. Europe has the potential to achieve net zero and in doing so become the Silicon Valley of Green Tech including the vibrancy, jobs and sustainability that comes with it.

Please continue to check back for a range of blog content and regular updates from us.

09/04/2021

Andrew Lloyd

Team No Comments

Brewin Dolphin – Markets in a Minute

Please see below this weeks update on markets from Brewin Dolphin. This update was received late yesterday afternoon:

Please continue to check our Blog content for advice and planning issues and the latest investment, markets and economic updates from leading investment houses.

Please keep safe and healthy.

Carl Mitchell – Dip PFS

IFA and Paraplanner

08/04/2021

Team No Comments

Weekly Market Commentary – Gains for equities despite European lockdown concerns

Please see below detailed economic and market news update received from the in-house research team at Brooks Macdonald yesterday afternoon.

A far stronger than expected US employment report spurs gains in equities

While Europe was on holiday, a bumper US jobs report on Friday drove risk assets higher on both sides of the Easter weekend. Survey data also beat expectations, and this was enough to allow equities to look through the pickup in global COVID-19 numbers.

The closely watched minutes from the March Federal Reserve meeting are released on Wednesday

The number of new jobs created in the US in March hit 916,000, far in excess of expectations of 660,0001. Standout areas included leisure and hospitality sectors, which are both reopening after being the hardest hit areas from the curbs on activity. The broadest measure of US unemployment, U-6, which includes not only the unemployed but those that are underemployed or discouraged from the workforce, fell but remains in excess of 10%2. For context, this measure was at 6.9% in January 20203 before the pandemic hit and still points to a sizeable gap until the US economy returns to ‘full’ employment. This elevated level of broad unemployment is often cited by US Federal Reserve (Fed) Chair Powell as a sign of the economic output gap that needs to be filled before inflationary pressures could become sustained. 

Since the Fed meeting in March, we have seen the market price in additional rate hikes as the vaccine rollout continues amidst the aforementioned stronger data. The Fed’s last statement said relatively little about how the bank would respond should benchmark Treasury yields continue to rise. As a result, this will be keenly watched for in the minutes released on Wednesday. The disconnect between what the market believes will occur and Fed guidance is widening by the day, so any sign that they will take concrete action will be important for the central bank to remain in the driving seat. This week also sees the European Central Bank minutes released on Thursday, where investors will be looking for further guidance on the pace of quantitative easing purchases over the next few months.

Third COVID-19 wave concerns continue in Europe as France enters lockdown

The counter to the data optimism is the third wave of the coronavirus pandemic which has caused Europe to move further towards lockdowns, with France beginning its lockdown over the weekend. This will remain a hot topic this week as the complicated interplay of vaccine rollouts and rising cases continues to muddy the short-term economic outlook.

Although the UK has been successful in its vaccine rollout so far, it is important for Europe and the rest of the world to achieve mass-vaccination as well. We will continue to publish relevant content as the lockdown rules continue to be relaxed.

Stay safe.

Chloe

07/04/2021

Team No Comments

Engagement with BP and Shell on the transition to a greener future

Please see the below ESG case study article from Invesco:

The below case study pertains to engagement within our UK equities team, which are a part of the Henley Investment Centre. While guided by our central ESG team, all of our investment professionals ultimately have discretion in their ESG decisions, and do not all follow the same approach. Learn more about how we integrate ESG across our wide range of strategies here.

Responsible oil and gas companies have a critical role to play in being part of the solution to environmental problems: in helping enable the global economy to successfully transition as rapidly as possible, and in a sustainable manner, towards targets for much reduced global emissions.

This can be achieved through actions taken by companies to successfully manage down a sustained decline in output of oil & gas, while at the same time maximising cash flows from operations for investment in new low carbon energy businesses.

Investing in oil companies that set out to achieve these objectives – and holding them accountable – is we believe entirely consistent with true responsible investing, which incorporates environmental, social, and governance (ESG) criteria into the investment process.

Whatever the moral burden that should fairly be borne by UK-listed companies, such as BP and Shell, for their historical actions, what is important for investors to understand is how the oil companies themselves now fit into the global industry.  Investors want to know what the impact of oil companies will be on that industry and on society, going forward: what role they have to play in the future.

How BP and Shell are transitioning towards a greener future

Although many investors focus on oil & gas producers as large Scope 3 emitters of carbon, if the world is to achieve net zero emissions in 2050 it ultimately requires reform of demand, and not just supply.

Supply in the industry (in the long run) very closely mirrors actual demand (the easiest place to store oil is still in the ground!). It is important here to also reflect that the global publicly quoted US and European oil companies only account for around 12.3 mb/d out of total current production of approximately 100mb/d, with US privately owned production around a further 8mb/d.

Put another way, state owned oil production (including Saudi Aramco) accounts for almost 80% of global production. The reality is that any cuts in production by any of the publicly quoted oil majors does not in itself affect global oil demand.

BP turning off the taps tomorrow would have a negligible effect on global carbon emissions. The same emissions will still be made but fuelled by output from another supplier who is less accountable to investors.

Responsible oil companies do, though, have a very significant role to play in accelerating a sustainable transition to low carbon alternatives that can reduce demand for fossil fuels by providing a viable substitute product.

For example, BP and Royal Dutch Shell are both actively involved in promoting the transition through defined strategies that look to maximise cash flows from existing carbon resources, and then re-allocate cash flows to low carbon alternatives.

Because of the many and varied uses for oil as a fuel, as a key component in a wide range of everyday products, and the practical limitations associated with various alternatives currently available, the process of transition is likely to be gradual. It is clearly both necessary and highly likely that demand for oil will reduce over time, however we do not foresee at any time in the next ten years at least, a “Kodak moment” for oil.

Our role as responsible shareholders will encourage positive change

An investor in BP or Shell who is willing to support, encourage and also hold the company to account during its transition period is, we believe, able to be well rewarded financially, through dividends and share buy backs, as well as by the prospect of owning a new “low carbon” and retail business whose growth has been fully funded from existing company resources.

Responsible oil & gas companies such as BP and Shell therefore have a critical role to play in being part of the solution: in helping enable the global economy to successfully transition as rapidly as possible, and in a sustainable manner.

This objective can be achieved through actions taken – with the support of shareholders – to successfully manage down a sustained decline in output, whilst at the same time maximising cash flows from operations for investment in new low carbon energy businesses.

We believe, investing in oil companies that set out to achieve these objectives, and holding them accountable, is entirely consistent with our philosophy of responsible investing, which focuses on engagement and dialogue with portfolio companies, and not simple divestment if there is something that we don’t like.

We expect big companies in this sector will be investing capital at scale in renewable energies and are well placed to manage large and complex engineering projects in hostile natural environments.  Again, the sector is part of the solution rather than just part of the problem.

Our engagement and dialogue – in practice

As active fund managers, ESG integration and dialogue is an important consideration for us. Over the past three years we have regularly engaged with various members of the Boards and Management Teams of both BP and Shell, on ESG matters in general, and on carbon emissions in particular.

In the case of BP, for example, we have had meetings with the BP Chairman to discuss the risks and opportunities associated with their carbon transition plan.

We have also provided feedback to the chair of the remuneration committee to ensure management incentivisation is aligned to group strategy and their environmental targets.

Furthermore, we have engaged with independent board members and attended company strategy sessions. The enhanced monitoring of our BP position over the last three years means that we believed that the strategy and objectives the company was setting were achievable.

Our engagement enables us to measure the board and management against their strategy and objectives. We believe there are good returns to be made from businesses which transform to become fit for the future.

When it comes to ESG or socially responsible investments, its important not just to use the traditional ethical investment screening (i.e. staying away from certain companies/ sectors etc), but to engage with companies to help deliver positive change.

By engaging with companies and holding them accountable, it forces them to think about the future, their practices and operations and helps to guide them into a better way of thinking.

It’s not about steering clear of companies or disinvesting if something happens investment managers don’t like, but about engaging with them, providing feedback and guidance about how they want things to work.

Positive engagement will help everybody to learn and adapt to what seems to becoming (or will become) an industry standard in how ESG processes are embedded into companies and the industry as a whole.

Keep checking back for more ESG related content from us along with our usual market commentary, planning points and other key issues we like to keep you up to date with.

Andrew Lloyd

06/04/2021

Team No Comments

J.P. Morgan – The impact of ESG factors on portfolio returns

Please see article below from J.P. Morgan which looks at the impact of ESG factors on portfolio returns, received 29/03/2021

The ESG factors that we expect to drive markets are at their infancy in terms of both introduction and market impact.

Karen Ward

How does incorporating information on environmental, social, and governance factors affect the performance of a portfolio?

Does incorporating these factors put a portfolio on a better footing to cope with a changing world and enhance returns? Or does ‘doing good’ with your capital come at a cost?

What about volatility? Does accounting for a wider range of future risks reduce the bumps? Or, by excluding sectors and companies, do we end up with a more concentrated and therefore more volatile portfolio?

In this piece, we look at this deeply complex issue. Empirical backtesting to gauge relative performance is fraught with practical difficulties, largely due to the lack of  quality historical data on which to score companies, though preliminary analysis suggests there is a relationship between ESG score and asset return.

There are also reasons to question whether historical analysis of this topic serves much purpose in thinking about future performance. Consumer preferences and regulatory and policy initiatives to tackle environmental, social and governance issues are moving at such pace that investors who are ahead of the change might be expected to see portfolio benefits, as certain recent events have demonstrated.

This paper lays out the issues that will be explored in more detail in our 2022 Long-Term Capital Markets Assumptions, which will be released in autumn this year.

Historically difficult to test

Before looking into preliminary results, it is worth pointing out some significant caveats to our ability to back-test the performance hypothesis. Problems arise in how to score a company on its E, S and G characteristics. There are external ratings agencies that provide company ‘scores’ but there are three issues worth remembering.1

First, methodology can be opaque and subjective and different providers often produce conflicting scores. A well-known electric vehicle producer is an oft-cited example: it is rated highly by one rating agency for its green credentials and poorly by another based on the agency’s assessment of its governance.

Second, coverage of companies isn’t always complete, and is particularly sketchy for smaller companies and in fixed income markets. In emerging markets, language issues can also be a barrier to the collection of accurate data.

Third and finally, the further we go back in time, the more likely it is that the scoring data does not adequately capture the real- time ESG challenges. The data may not have been available or disclosed at the time, and, more importantly, the data that is actually relevant to asset pricing has likely changed over time. Twenty years ago, governance may have been the biggest non- financial metric of concern for assessing the sustainability of corporate performance. Today, environmental issues are increasingly moving into sharper focus, as is the diversity of the workforce.

These data issues suggest we should be careful about leaning too heavily on backtesting. However, with these statistical caveats in mind, Exhibit 1 – which ranks companies using J.P. Morgan Asset Management’s proprietary ESG scores – suggests that there does appear to be a relationship between ESG score and performance relative to benchmark.

We will do future work on this question ahead of the publication of our Long-Term Capital Markets Assumptions, in order to assess the statistical significance of the relative performance, whether the relationship changes through time, and the relative importance of E, S, and G factors by region. Another important question requiring further exploration is whether it is the absolute ESG score or the change in the score that matters.

Exhibit 1: Mean active return by ESG quintile

% active return

Source: J.P. Morgan Asset Management. Charts show the mean active returns of the top and bottom quintile portfolios based on JPM proprietary quantitative ESG score, excluding transaction costs, in USD. Calculation periods are 31/12/2012 – 26/02/2021 for ACWI, Europe and North America and 28/02/2013 – 30/11/2020 for EMAP. Figures are shown as an annual rate. ACWI portfolios and benchmark constructed in the MSCI ACWI IMI universe filtered by market capitalisation > $1 billion, Europe portfolios are constructed using the Europe constituents of the aforementioned universe, North America portfolios are constructed using the North America constituents of the aforementioned universe, EMAP portfolios are constructed from the MSCI Emerging Markets index, stocks are weighted equally across the universe. Past performance is not a reliable indicator of current and future results. Data as of 28 February 2021.

It may be that the answer is ‘both’, with ‘good’ companies benefiting from macro news such as regulation and policy announcements and improvers representing company-specific or micro developments. We also need to evaluate the impact on portfolio volatility.

While it’s important to be careful about drawing conclusive evidence from past data, it is worth noting that we observe a relationship between ESG score and other traditional financial characteristics of ‘good management’, such as high return on equity (Exhibit 2), low leverage and low earnings variability. For this reason, incorporating ESG factors is often seen as an additional ‘quality’ screen. And the performance of companies screened on quality metrics is clear over the long term: MSCI Europe Quality has outperformed MSCI Europe by close to 4% annualised over the past 10 years.

Exhibit 2: Return on equity by ESG quintile

% return on equity

Source: J.P. Morgan Asset Management. Charts show the mean return on equity of the top and bottom quintile portfolios based on JPM proprietary quantitative ESG score, USD, ROE winsorised at plus / minus 100. ACWI portfolios are constructed in the MSCI ACWI IMI universe filtered by market capitalisation > $1 billion, Europe portfolios are constructed using the Europe constituents of the aforementioned universe, North America portfolios are constructed using the North America constituents of the aforementioned universe, stocks are weighted equally across the universe. Past performance is not a reliable indicator of current and future results. Data as of 28 February 2021.

Exclusions and short-term returns

The analysis above focuses on returns over long time periods.  At certain points in the economic cycle, excluding certain companies – such as gambling, tobacco, nuclear power, weapons, alcohol and energy companies – for ESG reasons can have meaningful implications for relative performance. Most obviously, excluding traditional energy companies from a portfolio will likely lead to outperformance when oil prices are falling, but potentially underperformance when oil prices and energy prices are rising. If energy is a large proportion of a benchmark, the relative impact is even greater. Looking at the impact of excluding energy in the UK (where energy is over 10% of MSCI UK) vs. the US (where energy is 3% of the S&P 500) during the rollercoaster in energy prices in 2020 demonstrates this point (Exhibit 3).

Exhibit 3: Impact of excluding energy from an index

Relative total return index level, rebased to 100 at the start of 2020

Source: MSCI, Standard & Poor’s, J.P. Morgan Asset Management. Past performance is not a reliable indicator of current and future results. Data as of 18 March 2021.

In addition, companies that do not have good long-term growth opportunities or ESG scores can still generate good financial returns, when profits are returned to shareholders or when there’s a grab for yield. A notable example is American tobacco companies, which have returned 13% annualised (including dividends) over the last 20 years, compared with 8.5% for the S&P 500.

Of course, for many investors, any return sacrifice may be entirely acceptable given their broader investment ambitions beyond financial returns.

The asymmetries in fixed income

On top of the issues described above, it’s worth spending a moment thinking about ESG, returns and fixed income. An equity share does not have a predefined time horizon, so for an equity investor the return depends on the payout prospects for the life of the asset. A fixed income investor holding a bond to maturity is just concerned about getting the agreed coupons and then the principal returned over a fixed time horizon, and this creates an asymmetry.

For example, consider a company that is on the right side of a new government announcement (for example, the producer of an alternative to single-use plastics after an announcement of a ban on single-use plastics). The stock investor sees a jump in the stock value, reflecting the enhanced outlook for long-term profits. A bond investor planning to hold the bond to maturity would not see an enhanced coupon or dividend, and so would not receive the same benefit from the announcement.

Now consider the company that is on the wrong side of a government announcement, with the long-term viability of its current business model challenged. The stock investor loses out immediately. Whether the fixed income investor loses out over the lifetime of the bond depends on whether the coupons or principal are at risk. They may not be on a very short-dated bond, but would be on a longer-dated bond.

Given this asymmetry, incorporating ESG factors in a fixed income portfolio might be expected to affect returns. Incorporating ESG factors can limit downside risk in a portfolio by capturing a broader range of potential sources of default risk. However, it could lead to underperformance if the issuer doesn’t default within the time horizon of the bond and the investor has forgone the higher spread that resulted from the pricing in of that risk.

In addition, as with equities, high yield energy will likely underperform when oil prices fall and outperform when they rise, so ESG exclusions can lead to periods of underperformance as well as outperformance. Again, in both instances, any return sacrifice may be entirely acceptable to investors who are seeking sustainable outcomes as well as financial returns.

Most importantly, history is unlikely to be a guide to the future

Even if it were possible to draw firm conclusions using historical index data, we would argue that history is unlikely to provide a guide to the future. That is because the ESG factors that we expect to drive markets are at their infancy in terms of both introduction and market impact.

Below we list five specific areas in which we believe ESG considerations have the potential to create market winners and losers:

Government ambitions and regulatory policy – Encouraged by the demands of their electorates, governments are increasingly focused on tackling issues such as social injustice and climate change. Policymakers have a variety of sticks and carrots at their disposal to drive change. One example of a ‘stick’ policy being used to tackle climate change is carbon pricing, which exerts a cost pressure on less energy efficient companies. An example of a carrot policy is a scrappage scheme that encourages consumers to dispose of petrol-fuelled cars for electric vehicles.

There is clear evidence that such political announcements have market implications. Take two examples from the last year. The surprise announcement by President Xi that China would commit to net-zero carbon emissions propelled solar and wind power companies higher (Exhibit 4). These companies are set to benefit from this positive policy support via an increase in subsidies as China moves to increase capacity, in line with its environmental goals of peak CO2 emissions in 2030 and net zero by 2060. This comes at a time when coal-fired producers are facing higher costs from rising coal prices and the cost of wind and solar are in decline. Renewable energy sources in China are expected to achieve grid-price parity with coal-fired producers in the next year.

Exhibit 4: Chinese renewables gain on policy announcements

Average of A and H share listed companies in each industry, rebased to 100 = 31 Jan 2020

Source: FactSet, J.P. Morgan Asset Management. Past performance is not a reliable indicator of current and future results. Data as at 12 March 2021.

Clean energy stocks have significantly outperformed global equities on the prospect of increased policy support from a Joe Biden presidency (Exhibit 5). Following the announcement that Biden had secured enough delegates for the Democratic nomination, clean energy stocks began to rise with the prospects of a Biden win at the election, as investors anticipated more policy action to address climate change. The rally in clean energy took another leg higher following the US election result, when a future infrastructure package came into focus.

January and February of this year provided a timely reminder that, even with these key policy supports in place, these sectors can still prove volatile. Investors should also be cognisant of the price that they are paying to access these secular trends, now that the policy tailwinds have become starkly apparent. The 12-month forward price-to-earnings ratio for the MSCI Global Alternative Energy Index has risen from 17x at the beginning of 2020 to 30x at the end of February 2021.

Exhibit 5: Clean energy performance

Total return index level, rebased to 100 at the start of 2020

Source: MSCI, J.P. Morgan Asset Management. Indices shown are total return in local currency. Past performance is not a reliable indicator of current and future results. Data as of 18 March 2021.

In essence, what is happening is governments are internalising the externality of environmental damage. But, almost by definition, this will come at a cost to some businesses. The UN Climate Change conference (COP26) in early November is a date investors should watch for the potential slew of new market-moving initiatives.

Central bank asset purchases and regulatory initiatives – While government policy is increasingly influencing the macro landscape, central banks are being asked to support these endeavours by ensuring that private capital forms part of the solution. Indeed, increasingly central banks (for example, the Bank of England) are having green targets added to their mandates. This works through two channels: 1) central banks can tailor their asset purchases to favour climate friendly companies and sovereigns and 2) they can use their regulatory levers to direct capital towards higher scoring companies (for example, through pension fund requirements).

The ambition and the potential consequences for asset prices are made clear in a recent speech by Pablo Hernández de Cos, governor of the Bank of Spain:2

“If we succeed in incorporating these [climate] risks into the decisions of the financial sector, this will translate into a change in the relative prices of financial instruments. And, in turn, that will help to internalise those consequences originating from both transition and physical risks that affect directly providers and users of funds. This will be a powerful and much-needed complement to the use of the fiscal and environmental instruments that are needed to fight against climate change.”

Disclosures – Central banks, regulators and governments are increasing transparency about ESG factors by forcing companies to disclose more ESG information about their businesses, from diversity statistics and pay of their employees to carbon emissions. This allows both consumers and investors to make more informed choices.

Consumer choices – Attitudes and resultant behaviours among consumers are changing rapidly, with potential consequences for the long-term profitability and potential performance of companies. Areas where consumers are having a significant impact range from specific preferences (such as the increasing rejection of single-use plastics) to reputational risk from poor corporate ESG choices. The latter is increasingly important given that intangible capital (brand) is an increasingly large component of many companies’ market value.

Cost of capital – All of the above factors have the potential to affect the revenue stream of companies. But there is also increasing evidence that they are driving corporate cost of capital (this yield premium has come to be known as the ‘greenium’). Therefore, from both revenue and cost sides, ESG factors are affecting the profitability and viability of companies.

Exhibit 6: Credit spread differential between green bonds and traditional bonds

Basis points, option-adjusted spread difference between green and traditional bonds

Source: Barclays Research, J.P. Morgan Asset Management. Data shown is for a Barclays Research custom universe of green and non-green investment grade credits, matched by issuer, currency, seniority and maturity. The universe consists of 94 pairs, 58 euro-denominated and 36 dollar-denominated, and 48 financials and 46 non- financials. Past performance is not a reliable indicator of current and future results. Data as of 9 February 2021.

Conclusion

Further work is required to demonstrate conclusively the extent to which E, S, and G factors have affected past performance. However, even when that analysis is complete, we would be cautious about using historical results as a guide to the future. We expect the shifts in government policy, regulation and consumer preferences to result in much larger leaps forward that will shift the macro landscape. It is by being ahead of those announcements in the coming years that we see the potential for investors to generate enhanced portfolio returns.

Please continue to check back for more ESG related articles and insights along with our usual blog posts and market updates.

Charlotte Ennis

01/04/2021