Please see article below from J.P. Morgan which looks at the impact of ESG factors on portfolio returns, received 29/03/2021
The ESG factors that we expect to drive markets are at their infancy in terms of both introduction and market impact.
Karen Ward
How does incorporating information on environmental, social, and governance factors affect the performance of a portfolio?
Does incorporating these factors put a portfolio on a better footing to cope with a changing world and enhance returns? Or does ‘doing good’ with your capital come at a cost?
What about volatility? Does accounting for a wider range of future risks reduce the bumps? Or, by excluding sectors and companies, do we end up with a more concentrated and therefore more volatile portfolio?
In this piece, we look at this deeply complex issue. Empirical backtesting to gauge relative performance is fraught with practical difficulties, largely due to the lack of quality historical data on which to score companies, though preliminary analysis suggests there is a relationship between ESG score and asset return.
There are also reasons to question whether historical analysis of this topic serves much purpose in thinking about future performance. Consumer preferences and regulatory and policy initiatives to tackle environmental, social and governance issues are moving at such pace that investors who are ahead of the change might be expected to see portfolio benefits, as certain recent events have demonstrated.
This paper lays out the issues that will be explored in more detail in our 2022 Long-Term Capital Markets Assumptions, which will be released in autumn this year.
Historically difficult to test
Before looking into preliminary results, it is worth pointing out some significant caveats to our ability to back-test the performance hypothesis. Problems arise in how to score a company on its E, S and G characteristics. There are external ratings agencies that provide company ‘scores’ but there are three issues worth remembering.1
First, methodology can be opaque and subjective and different providers often produce conflicting scores. A well-known electric vehicle producer is an oft-cited example: it is rated highly by one rating agency for its green credentials and poorly by another based on the agency’s assessment of its governance.
Second, coverage of companies isn’t always complete, and is particularly sketchy for smaller companies and in fixed income markets. In emerging markets, language issues can also be a barrier to the collection of accurate data.
Third and finally, the further we go back in time, the more likely it is that the scoring data does not adequately capture the real- time ESG challenges. The data may not have been available or disclosed at the time, and, more importantly, the data that is actually relevant to asset pricing has likely changed over time. Twenty years ago, governance may have been the biggest non- financial metric of concern for assessing the sustainability of corporate performance. Today, environmental issues are increasingly moving into sharper focus, as is the diversity of the workforce.
These data issues suggest we should be careful about leaning too heavily on backtesting. However, with these statistical caveats in mind, Exhibit 1 – which ranks companies using J.P. Morgan Asset Management’s proprietary ESG scores – suggests that there does appear to be a relationship between ESG score and performance relative to benchmark.
We will do future work on this question ahead of the publication of our Long-Term Capital Markets Assumptions, in order to assess the statistical significance of the relative performance, whether the relationship changes through time, and the relative importance of E, S, and G factors by region. Another important question requiring further exploration is whether it is the absolute ESG score or the change in the score that matters.
Exhibit 1: Mean active return by ESG quintile
% active return
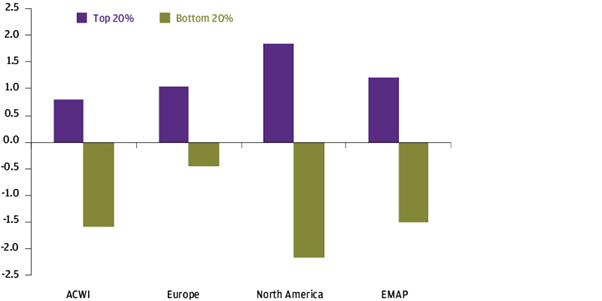
Source: J.P. Morgan Asset Management. Charts show the mean active returns of the top and bottom quintile portfolios based on JPM proprietary quantitative ESG score, excluding transaction costs, in USD. Calculation periods are 31/12/2012 – 26/02/2021 for ACWI, Europe and North America and 28/02/2013 – 30/11/2020 for EMAP. Figures are shown as an annual rate. ACWI portfolios and benchmark constructed in the MSCI ACWI IMI universe filtered by market capitalisation > $1 billion, Europe portfolios are constructed using the Europe constituents of the aforementioned universe, North America portfolios are constructed using the North America constituents of the aforementioned universe, EMAP portfolios are constructed from the MSCI Emerging Markets index, stocks are weighted equally across the universe. Past performance is not a reliable indicator of current and future results. Data as of 28 February 2021.
It may be that the answer is ‘both’, with ‘good’ companies benefiting from macro news such as regulation and policy announcements and improvers representing company-specific or micro developments. We also need to evaluate the impact on portfolio volatility.
While it’s important to be careful about drawing conclusive evidence from past data, it is worth noting that we observe a relationship between ESG score and other traditional financial characteristics of ‘good management’, such as high return on equity (Exhibit 2), low leverage and low earnings variability. For this reason, incorporating ESG factors is often seen as an additional ‘quality’ screen. And the performance of companies screened on quality metrics is clear over the long term: MSCI Europe Quality has outperformed MSCI Europe by close to 4% annualised over the past 10 years.
Exhibit 2: Return on equity by ESG quintile
% return on equity

Source: J.P. Morgan Asset Management. Charts show the mean return on equity of the top and bottom quintile portfolios based on JPM proprietary quantitative ESG score, USD, ROE winsorised at plus / minus 100. ACWI portfolios are constructed in the MSCI ACWI IMI universe filtered by market capitalisation > $1 billion, Europe portfolios are constructed using the Europe constituents of the aforementioned universe, North America portfolios are constructed using the North America constituents of the aforementioned universe, stocks are weighted equally across the universe. Past performance is not a reliable indicator of current and future results. Data as of 28 February 2021.
Exclusions and short-term returns
The analysis above focuses on returns over long time periods. At certain points in the economic cycle, excluding certain companies – such as gambling, tobacco, nuclear power, weapons, alcohol and energy companies – for ESG reasons can have meaningful implications for relative performance. Most obviously, excluding traditional energy companies from a portfolio will likely lead to outperformance when oil prices are falling, but potentially underperformance when oil prices and energy prices are rising. If energy is a large proportion of a benchmark, the relative impact is even greater. Looking at the impact of excluding energy in the UK (where energy is over 10% of MSCI UK) vs. the US (where energy is 3% of the S&P 500) during the rollercoaster in energy prices in 2020 demonstrates this point (Exhibit 3).
Exhibit 3: Impact of excluding energy from an index
Relative total return index level, rebased to 100 at the start of 2020

Source: MSCI, Standard & Poor’s, J.P. Morgan Asset Management. Past performance is not a reliable indicator of current and future results. Data as of 18 March 2021.
In addition, companies that do not have good long-term growth opportunities or ESG scores can still generate good financial returns, when profits are returned to shareholders or when there’s a grab for yield. A notable example is American tobacco companies, which have returned 13% annualised (including dividends) over the last 20 years, compared with 8.5% for the S&P 500.
Of course, for many investors, any return sacrifice may be entirely acceptable given their broader investment ambitions beyond financial returns.
The asymmetries in fixed income
On top of the issues described above, it’s worth spending a moment thinking about ESG, returns and fixed income. An equity share does not have a predefined time horizon, so for an equity investor the return depends on the payout prospects for the life of the asset. A fixed income investor holding a bond to maturity is just concerned about getting the agreed coupons and then the principal returned over a fixed time horizon, and this creates an asymmetry.
For example, consider a company that is on the right side of a new government announcement (for example, the producer of an alternative to single-use plastics after an announcement of a ban on single-use plastics). The stock investor sees a jump in the stock value, reflecting the enhanced outlook for long-term profits. A bond investor planning to hold the bond to maturity would not see an enhanced coupon or dividend, and so would not receive the same benefit from the announcement.
Now consider the company that is on the wrong side of a government announcement, with the long-term viability of its current business model challenged. The stock investor loses out immediately. Whether the fixed income investor loses out over the lifetime of the bond depends on whether the coupons or principal are at risk. They may not be on a very short-dated bond, but would be on a longer-dated bond.
Given this asymmetry, incorporating ESG factors in a fixed income portfolio might be expected to affect returns. Incorporating ESG factors can limit downside risk in a portfolio by capturing a broader range of potential sources of default risk. However, it could lead to underperformance if the issuer doesn’t default within the time horizon of the bond and the investor has forgone the higher spread that resulted from the pricing in of that risk.
In addition, as with equities, high yield energy will likely underperform when oil prices fall and outperform when they rise, so ESG exclusions can lead to periods of underperformance as well as outperformance. Again, in both instances, any return sacrifice may be entirely acceptable to investors who are seeking sustainable outcomes as well as financial returns.
Most importantly, history is unlikely to be a guide to the future
Even if it were possible to draw firm conclusions using historical index data, we would argue that history is unlikely to provide a guide to the future. That is because the ESG factors that we expect to drive markets are at their infancy in terms of both introduction and market impact.
Below we list five specific areas in which we believe ESG considerations have the potential to create market winners and losers:
Government ambitions and regulatory policy – Encouraged by the demands of their electorates, governments are increasingly focused on tackling issues such as social injustice and climate change. Policymakers have a variety of sticks and carrots at their disposal to drive change. One example of a ‘stick’ policy being used to tackle climate change is carbon pricing, which exerts a cost pressure on less energy efficient companies. An example of a carrot policy is a scrappage scheme that encourages consumers to dispose of petrol-fuelled cars for electric vehicles.
There is clear evidence that such political announcements have market implications. Take two examples from the last year. The surprise announcement by President Xi that China would commit to net-zero carbon emissions propelled solar and wind power companies higher (Exhibit 4). These companies are set to benefit from this positive policy support via an increase in subsidies as China moves to increase capacity, in line with its environmental goals of peak CO2 emissions in 2030 and net zero by 2060. This comes at a time when coal-fired producers are facing higher costs from rising coal prices and the cost of wind and solar are in decline. Renewable energy sources in China are expected to achieve grid-price parity with coal-fired producers in the next year.
Exhibit 4: Chinese renewables gain on policy announcements
Average of A and H share listed companies in each industry, rebased to 100 = 31 Jan 2020
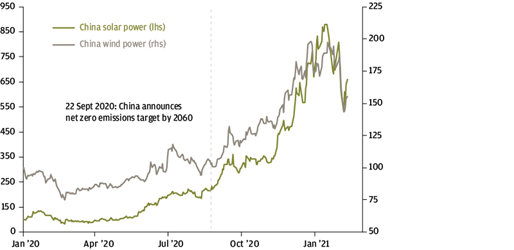
Source: FactSet, J.P. Morgan Asset Management. Past performance is not a reliable indicator of current and future results. Data as at 12 March 2021.
Clean energy stocks have significantly outperformed global equities on the prospect of increased policy support from a Joe Biden presidency (Exhibit 5). Following the announcement that Biden had secured enough delegates for the Democratic nomination, clean energy stocks began to rise with the prospects of a Biden win at the election, as investors anticipated more policy action to address climate change. The rally in clean energy took another leg higher following the US election result, when a future infrastructure package came into focus.
January and February of this year provided a timely reminder that, even with these key policy supports in place, these sectors can still prove volatile. Investors should also be cognisant of the price that they are paying to access these secular trends, now that the policy tailwinds have become starkly apparent. The 12-month forward price-to-earnings ratio for the MSCI Global Alternative Energy Index has risen from 17x at the beginning of 2020 to 30x at the end of February 2021.
Exhibit 5: Clean energy performance
Total return index level, rebased to 100 at the start of 2020
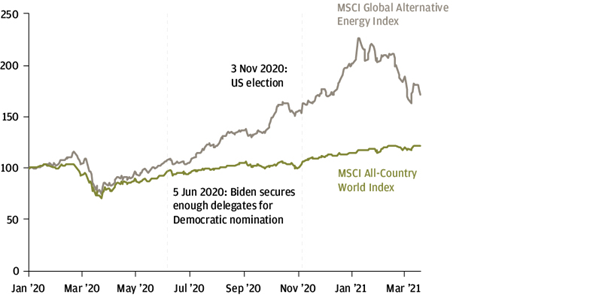
Source: MSCI, J.P. Morgan Asset Management. Indices shown are total return in local currency. Past performance is not a reliable indicator of current and future results. Data as of 18 March 2021.
In essence, what is happening is governments are internalising the externality of environmental damage. But, almost by definition, this will come at a cost to some businesses. The UN Climate Change conference (COP26) in early November is a date investors should watch for the potential slew of new market-moving initiatives.
Central bank asset purchases and regulatory initiatives – While government policy is increasingly influencing the macro landscape, central banks are being asked to support these endeavours by ensuring that private capital forms part of the solution. Indeed, increasingly central banks (for example, the Bank of England) are having green targets added to their mandates. This works through two channels: 1) central banks can tailor their asset purchases to favour climate friendly companies and sovereigns and 2) they can use their regulatory levers to direct capital towards higher scoring companies (for example, through pension fund requirements).
The ambition and the potential consequences for asset prices are made clear in a recent speech by Pablo Hernández de Cos, governor of the Bank of Spain:2
“If we succeed in incorporating these [climate] risks into the decisions of the financial sector, this will translate into a change in the relative prices of financial instruments. And, in turn, that will help to internalise those consequences originating from both transition and physical risks that affect directly providers and users of funds. This will be a powerful and much-needed complement to the use of the fiscal and environmental instruments that are needed to fight against climate change.”
Disclosures – Central banks, regulators and governments are increasing transparency about ESG factors by forcing companies to disclose more ESG information about their businesses, from diversity statistics and pay of their employees to carbon emissions. This allows both consumers and investors to make more informed choices.
Consumer choices – Attitudes and resultant behaviours among consumers are changing rapidly, with potential consequences for the long-term profitability and potential performance of companies. Areas where consumers are having a significant impact range from specific preferences (such as the increasing rejection of single-use plastics) to reputational risk from poor corporate ESG choices. The latter is increasingly important given that intangible capital (brand) is an increasingly large component of many companies’ market value.
Cost of capital – All of the above factors have the potential to affect the revenue stream of companies. But there is also increasing evidence that they are driving corporate cost of capital (this yield premium has come to be known as the ‘greenium’). Therefore, from both revenue and cost sides, ESG factors are affecting the profitability and viability of companies.
Exhibit 6: Credit spread differential between green bonds and traditional bonds
Basis points, option-adjusted spread difference between green and traditional bonds
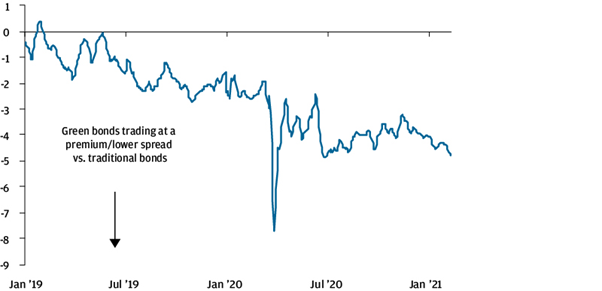
Source: Barclays Research, J.P. Morgan Asset Management. Data shown is for a Barclays Research custom universe of green and non-green investment grade credits, matched by issuer, currency, seniority and maturity. The universe consists of 94 pairs, 58 euro-denominated and 36 dollar-denominated, and 48 financials and 46 non- financials. Past performance is not a reliable indicator of current and future results. Data as of 9 February 2021.
Conclusion
Further work is required to demonstrate conclusively the extent to which E, S, and G factors have affected past performance. However, even when that analysis is complete, we would be cautious about using historical results as a guide to the future. We expect the shifts in government policy, regulation and consumer preferences to result in much larger leaps forward that will shift the macro landscape. It is by being ahead of those announcements in the coming years that we see the potential for investors to generate enhanced portfolio returns.
Please continue to check back for more ESG related articles and insights along with our usual blog posts and market updates.
Charlotte Ennis
01/04/2021