Please see below commentary received from Invesco this morning, which analyses market performance over the past week – as the IMF predicts strong economic recovery this year.
The IMF’s latest World Economic Outlook, published last week, reaffirmed the forecasting community’s expectation of a strong economic recovery in 2021. The rollout of multiple vaccines, better than expected adaption to pandemic life, additional fiscal support in some countries, particularly the US, and continuing monetary accommodation (the Fed reaffirmed during the week that the bar for tapering asset purchases, the first stage in tightening policy, remains high) underpinned the IMF’s 50bp upgrade to 2021 forecasts, from an already strong 5.5% to 6%. However, the IMF continues to expect that differences in the pace of the vaccine rollout, the extent of policy support and structural factors, such as the reliance on tourism, will ensure any recovery will be a multi-speed one. The US leads the way among advanced economies (see chart of the week) and is forecast to surpass its pre-Covid GDP levels this year, while many others (including the UK) won’t do so until 2022. It’s a similar picture in emerging economies, where China already returned to pre-Covid levels in 2020, but many others are not expected to do so until 2023.
While global equities had a good week overall (MSCI ACWI 1.8%), hitting a new all-time high, not all markets made gains. While DM were up 2.2%, EM continued to struggle, falling 0.6%, led lower by Asia (EM Asia -0.8%). EM are now over 7% below their 12.5% YTD high and are around 4.5% behind DM. As markets have rallied, expectations of future volatility have declined, with the VIX dropping to below 17 for the first time since pre-pandemic, but that remains well above the historical lows (<10) of the late 2010s. DM performance was led by US equities, with the S&P 500 up just under 3% and hitting a new all-time high. Europe also made gains and is the strongest DM region YTD (MSCI Europe ex UK 10.4%). While Small Caps underperformed (0.8%) they remain well ahead of the overall market YTD. EM and DM small caps have risen broadly in-line. At a sector level, tech-related sectors dominated performance, with IT (3.8%) and Communication Services (2.3%) leading the way. Energy (-2.5%) struggled against a weaker oil price, although remains the best performing sector YTD. In a risk-on environment, defensive sectors underperformed and remain the market laggards. Consumer Staples and HealthCare are only up 2-3% YTD. It was a rare week of Growth (2.8%) outperformance against Value (0.9%). Momentum (2.6%) and Quality (2.4%) also performed well. UK equities outperformed (All Share +2.8%), with both mid and small caps hitting new all-time highs. A weaker £ and an easing of lockdown measures underpinned the market.
Government bond yields were relatively stable, with 10yr USTs, Gilts and JGBs seeing 1-2bp declines. There was modest upward pressure in EZ yields with the 10yr Bund and BTP up 3bp and 11bp respectively. Overall global government bonds are still down YTD (-2.9%), with Gilts and USTs the main laggards. Credit yields and spreads edged lower in both IG and HY, with the latter outperforming (0.5% vs 0.2%). HY is comfortably ahead YTD (1.3% vs -2.7%) with the EZ the best of the regional markets in both IG and HY.
The US$ gave up some of its recent gains with the US Dollar Index down 0.9%, its worst week since December, as both the Euro (1.1%) and Yen (0.9%) appreciated. £ was an outlier, declining 0.7% and back close to its YTD lows at just over $1.37.
After a strong start to the year (up 34% at one point), oil prices have struggled in recent weeks and gave up 2.5% last week as virus-related demand concerns remained and OPEC+ decided to increase supply between May and June by 2mbd. Although it saw a small gain, Copper has struggled to regain momentum since reaching a 9-year high in February as demand concerns, a stronger US$ and rising inventories have weighed on sentiment. Gold (0.8%) has bounced off its lows as a stabilisation in real yields and a weaker US$ have provided some support. It is still down 8% YTD.
Market performance last week (%)
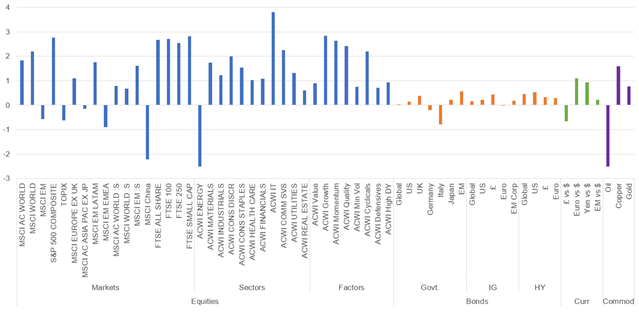
Past performance is not a guide to future returns. Sources: Datastream as at 11 April 2021. See important information for details of the indices used.
YTD market performance (%)

Past performance is not a guide to future returns. Sources: Datastream as at 11 April 2021. See important information for details of the indices used.
Chart of the week: ISM Services PMI Index and S&P 500 performance

Past performance is not a guide to future returns. Source: Datastream as at 12 April 2021. Price only performance.
- There have been a series of much stronger than expected US economic data releases since the start of April. These include the ISM Manufacturing PMI, that hit its highest level since December 1983, and Non-Farm Payrolls that at 916k came in much better than expected (albeit seasonal effects probably overstated the degree of the beat). Last Monday we saw the ISM Services PMI hit an all-time high of 63.7, rising from 55.3 and well ahead of consensus expectations of 59 (remember here that PMIs are diffusion indices, so tell us the percentage of firms that are experiencing an uptick in business and do not give a sense of the magnitude). While the Services PMI has a much shorter history (since 1997) than the Manufacturing PMI (since 1948), it remains a key guide to business sentiment in what is, of course, the dominant sector in the US economy.
- And as the chart highlights there has historically been a close relationship between equity market performance and the Services PMI. The correlation is a high 64%, only marginally lower than the 67% correlation with the Manufacturing PMI over the same time period. Given this relationship and the strength of the Services (and Manufacturing) recovery from the pandemic lows, its hardly a surprise that the equity market performance has been so strong.
- Clearly there is a big surge in activity under way as the weather improves. Alongside that, although new cases have picked up recently, the substantial drop in virus case numbers from the second wave peak and the successful rollout of the vaccination programme (34% have received their first shot) has allowed lockdown restrictions to be lifted at the same time as Biden’s $1.9trn in additional fiscal stimulus boosts incomes. And the improvement in the PMI has been broad-based, with all eighteen industries reporting growth. Among the key sub-components of the index the largest gains were seen in Business Expectations (+13.9pts to 69.4) and New Orders (+15.3pts to 67.2), both at record levels. Employment also saw an improvement, reflecting the strong Non-Farm Payrolls numbers, and at 57.2 is back at pre-pandemic levels.
- For those concerned about a potential lift-off in inflation, there were further signs that inflation pressures continue to rise. The Prices index rose to 74, its highest level since 2008, a similar picture to what we saw with Manufacturing (85.6). Time will tell whether that turns into a sustained and/or substantial rise in inflation, forcing a change in policy stance from the Federal Reserve. For now, the Federal Reserve thinks not. The risk is that they are wrong.
Key economic data in the week ahead
- A relatively quiet week ahead with China’s Q1 GDP and US inflation the main features.
- In the US March’s Inflation data is out on Tuesday. Headline and Core are expected to rise 0.5%mom and 0.2%mom respectively. This would take them to 2.5%yoy and 1.6%yoy, the former the highest it has been since before the pandemic. Initial Jobless Claims posted a surprise uptick last week to 744k. It is expected to drop to 700k on Thursday – still elevated given the strength of the economic recovery. On the same day Retail Sales for March are also forecast to jump thanks to the latest round of stimulus cheques and improved weather. An increase of 5.5%mom is pencilled in following the 3% drop in February. Following the recent batch of positive economic data, the University of Michigan Consumer Sentiment index for April on Friday is expected to rise to 89 from 84.9, the highest reading since March of last year.
- The only data point of note in the UK is February’s monthly GDP published on Tuesday. Although economic activity is expected to have picked up, increasing 0.5%mom after January’s 2.9% contraction, the rolling 3m number is expected to remain negative at -1.9%. Improvement in services is the key driver here, with February forecast at 0.5%mom after the 3.5%mom fall in January.
- In the EZ Retail Sales data for February is released on Monday. A small 1.3%mom gain is forecast, but still leaving a -5.4%yoy shortfall. February’s Industrial Production numbers are released on Wednesday. A -1%mom decline is expected, leaving it at -1%yoy.
- In China Q1 GDP is published on Friday. A quarterly gain of 1.4%qoq is forecast, leaving the economy higher by 18.3%yoy. The increase in economic activity is expected to be broad based, with Industrial Production, Retail Sales and Exports forecast to rise 27.6%yoy, 28%yoy and 28%yoy respectively.
- There is no data release of significance from Japan this week.
We will continue to publish relevant market analysis and news as we enter the 10-week countdown to the end of the UK’s national lockdown.
Stay safe.
Chloe
12/04/2021