Team No Comments

Bouncebackability

Please see below article received from Legal & General yesterday afternoon, which offers insightful analogies relating to inflation and current global market performance.

When two people jump on a trampoline simultaneously, their gravitational potential energy (what goes up must come down) is converted into elastic potential energy in the trampoline (what goes down must come up). If one of the participants (the bouncer) lifts up their legs at the point of maximum trampoline stretch, all the energy is transferred to the other participant (the bouncee). This launches the bouncee into the air much more emphatically than a single person could achieve by themselves. If the bouncer is a lot heavier than the bouncee, then the results can be spectacular. This phenomenon makes us think of inflation today.

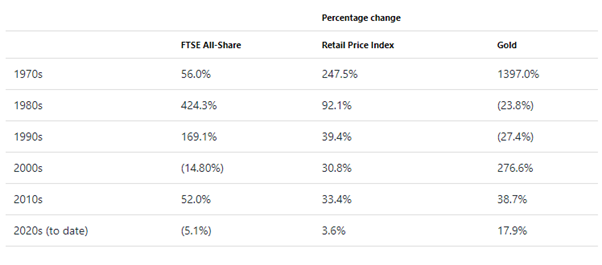
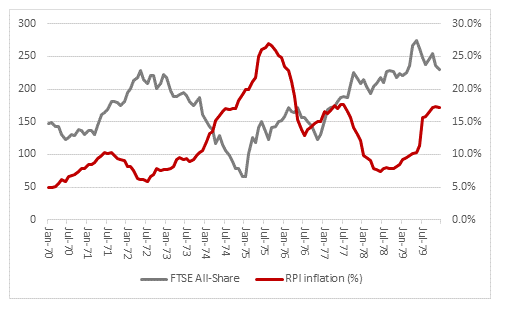
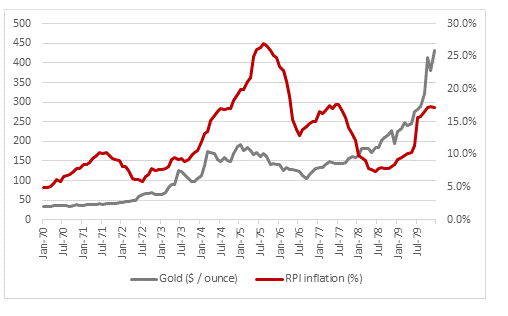
Trampolines and inflation

In this analogy, the pandemic is the bouncer and prices are the bouncee. Historically, prices that fall hard have had little tendency to revert. As former Crystal Palace manager Iain Dowie might have put it, there normally isn’t much “bouncebackability”.

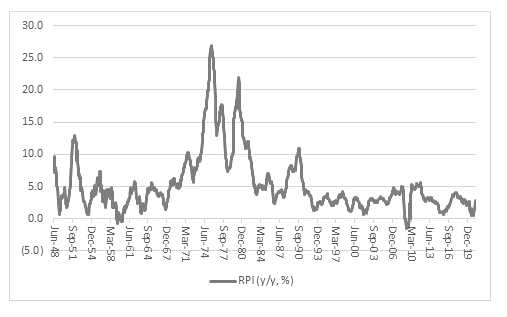
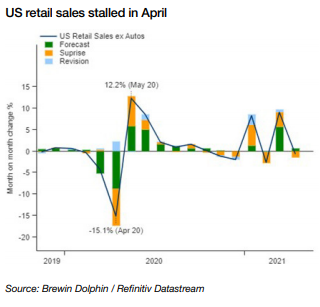
But prices have been emphatically “double bounced” in recent months: the pandemic exerted incredibly unusual downward pressures as demands for hotels, restaurants and airlines collapsed. That stretched the trampoline elastic to its limits. Suddenly removing the pressure has catapulted prices higher, with a slew of indicators pointing to near-term inflation taking off.

Having been double bounced, the question is whether inflation will stay high. It is tempting to believe high prices will stay high forever, but financial markets seem to be buying into the Crystal Palace prognosis. Dowie’s comments were triggered by the team bouncing back into the Premier League in the 2003-04 season from a seemingly dire position in mid-November. However, they were relegated again the following season.

Similarly, the US inflation curve is inverted: after a bout of higher inflation over the next few years, markets are priced for a return to something more normal thereafter. Sinkbackability is the flipside of bouncebackability.

The post-recession equity playbook

If you were worried about equity valuations before, are you a little less worried now? Since mid-April, the S&P 500’s forward price-to-earnings (P/E) ratio is down by over a point. At 21.3x we can’t exactly call it cheap, but it reflects an encouraging trend and one we expect to continue for some time. Put another way, the forward earnings yield has increased by around 0.2%.

In a benign de-rating, share prices are up, but by less than earnings; P/E ratios decline as a result. Since mid-April, the S&P 500 is up marginally, but the next 12 months’ forecast earnings are up by 7%.

We’re not just seeing this picture in the US, either. Estimates of forward earnings are upby 5.5% in Europe, and 8% for the DAX; even the less-cyclical FTSE 100 has seen forward earnings estimates rise by 3.5%.

This is a normal pattern after recessions, so not entirely unexpected. But it’s noteworthy that it has started, because until now it had been missing from this cycle.

In Phase 1 after a recession, prices typically go up a lot more than earnings, in anticipation of the earnings rebound. That would be the P/E expansion we had last year. In Phase 2, that picture reverses and earnings go up by more than prices, so P/E ratios contract. That’s what we’re seeing now.

The S&P 500 grinding higher with headline valuations drifting lower is the general pattern we expect to see over the next year. We are therefore relatively relaxed about high P/E ratios today, with a lot of earnings growth likely to be ahead. If we were to be at these same multiples this time next year, we would be a lot more worried.

A tinker, not a taper

Have US interest rates been rising or falling recently? It seems like a straightforward question with a straightforward answer. The first quarter was the fifth-worst quarter for US Treasuries in the past three decades, as 10-year yields rose by nearly 90 basis points. Every market commentator under the sun is now talking about a “rising interest rate environment” and what that means for other asset prices. But, did you know that US money-market rates have just fallen to all-time lows?

That seems a symptom of a superabundance of cash looking for a home in short-dated securities. The Federal Reserve is hosing the financial system with money and there simply isn’t enough short-dated government debt to go around.

Does any of this matter for assets outside the money-market space? We can think of two implications.

First, the dollar’s been weak at the same time as the short end of the yield curve has been collapsing since March this year. The Bank of England’s Jan Vlieghe has signalled a possible rate hike in the UK as early as May next year, we had a similar nod from New Zealand last week, and the rates payable on emerging currencies have started to drift higher. As long as the Federal Reserve refuses to even “think about thinking about” raising rates, it’s hard to see the dollar trend turn around.

Second, we’ve seen general collateral and triparty repo rates nailed to the floor in recent months, down from +10 basis points at the end of last year. That’s not a huge change, but it makes it that little bit cheaper to fund long-duration positions or more expensive to fund short-duration positions. We are tactically short duration, but the emphasis is on ‘tactically’, given the carry costs (which are getting steadily worse) and positioning.

To ‘fix’ the problem, we expect the Federal Reserve to push up its administered rates at the next opportunity in June. Precedent for tinkering with the Interest On Excess Reserves (IOER) can be found in both June 2018 and January 2020. The trick this time will be to persuade the markets that this adjustment is not a tightening of monetary policy. A tinker, not a taper, will be the order of the day.

We will continue to publish relevant content as we edge towards ‘Freedom Day’ on the 21st of June.

Stay safe.

Chloe

02/06/2021 

Team No Comments

The Implications of Carbon Pricing Initiatives for Investors

Please see the below article received from JP Morgan this morning:

‘In our view regulatory interventions will increase, and these interventions will underpin carbon prices not only in Europe, but also globally.’ – Vincent Juvyns

European policymakers have been focused on tackling climate change for many years. The launch of the European Union’s (EU’s) Emission Trading System (ETS) in 2005, the first carbon market in the world, has been the cornerstone of the bloc’s policy efforts. Since then, the ETS has been upgraded several times to reflect the EU’s growing climate ambitions and changes are now accelerating further since the EU has agreed to reduce its greenhouse gas (GHG) emissions by at least 55% by 2030. These regulatory initiatives at least partly explain why prices for CO2 emissions allowances in Europe have recently reached an all-time high of 56 euros per tonne of carbon dioxide equivalent (tCO2e).

The EU’s example is being increasingly copied, with several individual countries launching their own emission trading systems. At present, global carbon prices remain well below those seen in Europe. If they fail to move in line with what the EU deem to be acceptable, the subject of carbon taxes at the EU border will be an increasing reality. This is why we believe investors should be aware of the impact of higher carbon prices on their portfolio.

What drives carbon prices? Europe case study

There are two main types of carbon pricing mechanisms: a carbon tax, which is the most direct way to set a price on carbon, but which doesn’t set a pre-defined emission reduction target; and an emissions trading system, which caps the total level of GHG emissions, but doesn’t set a pre-defined price.

The EU chose the second approach when it created its ETS in 2005. The EU’s ETS is the world’s first and also the largest emissions trading system as it covers 45% of the EU’s GHG emissions produced by three sectors within the European Economic Area: electricity/heat generation, energy-intensive industry, and commercial aviation.

Companies in these sectors are allocated a free emissions allowance. Those with lower emissions than their allowance can sell their “unrequired” emissions to other companies in the sector (Exhibit 1). The balance between supply and demand for emissions creates a market price.

The EU can influence supply and demand dynamics to raise the carbon price in three ways: by reducing the emissions cap; by increasing the industries subject to the scheme; and/or by reducing the allocation that is deemed free.

In its recent directive, the EU decided that the aggregate emissions cap will fall by 2.2% per year from 2021 onwards (vs. 1.74% before). The EU is still deciding whether to include new sectors, such as transportation and buildings. The percentage of free emissions allowances, which had already fallen from 80% in 2005 to 43% in 2020, is to gradually decrease to 30%.

As a result, while some of the recent surge in the carbon price may reflect strong demand for emissions allowances as firms meet rising demand, there is a structural underpinning to higher carbon prices from regulatory interventions.

The balancing act between internal drive and external competition

EU authorities are mindful of the delicate balancing act they face between meeting domestic climate ambitions while at the same time not damaging corporate profitability and competitiveness compared to international competitors that are not subject to similar regulatory standards. Encouraging international peers to keep up with the EU’s efforts is bearing some fruit: other regions are beginning to launch their own emissions trading schemes and 25% of global GHG emissions are now covered by carbon pricing initiatives compared to just 5% in 2005 (Exhibit 2). However, the carbon price in these regions is much lower than in Europe (Exhibit 3).

Coverage of global emissions trading schemes and the impact on carbon prices

Exhibit 2: Global emissions covered by carbon pricing initiatives

% of global greenhouse gas emissions

Exhibit 3: Emissions trading system prices

USD per tonnes of CO2 equivalent

Carbon prices internationally are not only lower than those in the EU, they are also below those required to meet the global climate objective of reaching net zero emissions by 2050 according to many climate scientists and policymakers. Although the estimate is wide, a range of between USD 40 and USD 80 per tCO2e is often argued as necessary to limit global warming to less than 2°C.

Carbon prices will no doubt be a key topic of conversation when global leaders convene at COP26 in November. If the EU, China and the US cannot agree on a path towards a common carbon price, the EU may need to find a short-term solution to ensure that its climate efforts do not disadvantage European businesses.

One solution that appears to be growing in appeal is a carbon border adjustment mechanism (CBAM). This import tariff would be designed to ensure that the environmental footprint of a product is priced the same whether it is manufactured locally or imported. The CBAM is one of the key measures discussed as part of the EU’s Green Deal. The proceeds of the tax would form part of the EU’s budget, which would be used to finance the EU’s recovery and green transition.

At this stage the CBAM is a threat to international peers, but the credibility of that threat has been strengthened given the legislation that would be required has been approved by the European Parliament. It is now up to the European Commission to decide whether to use it.

Investment implications

In our view regulatory interventions will increase, and these interventions will underpin carbon prices not only in Europe, but also globally. The result will be an increase in the cost base of companies in a growing number of sectors.

One of the key investment implications is that increased business costs may serve to raise consumer prices, adding to growing inflationary pressures from loose monetary and fiscal policies. If firms are unable to pass on higher costs the higher carbon prices may dent profitability.

If the CBAM is activated, companies that export a lot of their carbon-intensive products to the EU may suffer from higher carbon prices, even if their home country does fairly little in terms of carbon regulation. The price of carbon is therefore a risk that needs to be monitored.

On top of traditional financial analysis, investors may look to evaluate non-financial parameters, such as the carbon intensity of companies, as we believe that minimising the carbon intensity of a portfolio should help improve its risk/return profile over the long term. This is what we have already observed over the last couple of years when comparing the MSCI World index with the MSCI World Climate Change CTB Select, a Climate Transition Benchmark under the EU Benchmark Regulation, which reweights securities based upon the opportunities and risks associated with climate transition risks.

Indeed, the MSCI World Climate Change CTB Select Index has a Weighted Average Carbon Intensity (which represents the number of metric tonnes CO2 equivalent emissions per USD million enterprise value including cash) that is almost 40% lower than the MSCI World Index, while it has also outperformed the latter by 150 basis points since its inception in November 2013, and has a better Sharpe ratio over the last three and five years.

With global carbon prices set to increase further in the future, minimising the GHG emissions of a portfolio should not only contribute to the fight against global warming, but it should also lead to better risk-adjusted returns in the long run.

Please continue to check back for a range of blog content, from ESG focused pieces like this one to market updates and insights from a variety of the worlds’ leading investment houses.

Andrew Lloyd

01/06/2021

Team No Comments

AJ Bell – Potential shift by US central bank could be bad for stocks

Please see article below from AJ Bell – received yesterday afternoon 27/05/2021

Potential shift by US central bank could be bad for stocks

The Federal Reserve is walking an increasingly wobbly tightrope between maintaining economic recovery and appeasing investors’ inflation worries

Investors should watch the US Federal Reserve very closely as the central bank is showing signs of a shift in thinking. This could have major implications for the direction of stocks.

The US economy grew at an annual rate of 6.4% in the first quarter of 2021, the second fastest since 2003 while initial jobless claims dropped to a post-pandemic low in the period.

Even so, the US Federal Reserve, which sets monetary policy, has vowed to keep interest rates close to zero until it sees clear evidence of sustained growth and the jobs lost during the pandemic regained.

The Fed interprets increasing inflation as a temporary phenomenon caused by the base effect from last year’s lockdowns and supply chain disruptions. That was the consensus view until the 19 May release of minutes from April’s policy making committee meeting.

It now seems a greater number of committee members are beginning to think about slowing the pace of asset purchases which have been running at $120 billion a month since June 2020.

The asset purchase programme is designed to support the economy and smooth the path back to growth after the pandemic.

Historically, reducing asset purchases, which is called ‘tapering’, has had a big impact on financial markets, creating heightened volatility in so-called ‘taper tantrums’. In 2013 when Fed chairman Ben Bernanke attempted to taper asset purchases, markets panicked, and bond yields spiked higher.

The risk to the Fed’s policy of waiting for more evidence is that the markets perceive the central bank to be behind the inflation curve which could lead to an even bigger shock when it eventually changes policy.

Judging by the Bank of America’s latest fund manager survey, investors are already ahead of the central bank with around two thirds of respondents saying they expect global inflation and growth to remain above trend. More than a third of fund managers think inflation is now the biggest threat to the global economy.

Lawrence Summers, former US Treasury Secretary and Harvard University economist, has criticised the Fed for creating a ‘dangerous complacency’ in financial markets and misreading the economy.

Even the Federal Reserve’s own Financial Stability Report warned (7 May) that ‘asset prices may be vulnerable to significant declines should risk appetite fall’. It noted ‘a number of nonprice measures suggest that investor appetite for equity risk is elevated relative to history’.

For example, it highlighted the pace of new companies listing on the stock market was at its highest since the late 1990s.

The increasing probability of inflation shocks and elevated risk-taking suggests investors should heed Warren Buffett’s advice to be fearful when others are greedy.

Please continue to check back for our regular blog posts and updates.

Charlotte Ennis

28/05/2021

Team No Comments

Invesco – Tech stock’s short-term struggles may lead to long-term buying opportunities

Please see below an article from Kristina Hooper, Chief Global Market Strategist for Invesco, which was published yesterday and details her views on the role of Tech stocks:

As you can see from the above article, it is Invesco’s view that tech stocks still have a valuable role to play in an investor’s portfolio. They believe the long-term benefits of tech stocks outweigh the short-term headwinds the industry is currently experiencing.

Tech stocks can still play a pivotal role in constructing a portfolio. However, diversification will remain important. Don’t have all your eggs in one basket.

Please continue to check our Blog content for advice and planning issues and the latest investment, markets and economic updates from leading investment houses.

Please keep safe and healthy.

Carl Mitchell – Dip PFS

IFA and Paraplanner

27/05/2021

Team No Comments

PruFund range of funds – EGR and UPA announcement

Please see below for Prudential’s latest announcement regarding Unit Price Adjustments for the PruFund range of funds, received by us late yesterday 25/05/2021:

At this quarter’s review, we’ve announced no change to the Expected Growth Rates (EGR) and upward Unit Price Adjustments (UPA) to a number of the PruFund range of funds this quarter end.

PruFund UPA announcement 

Today we’ve announced there’s upward UPAs to the following PruFund funds:

FundUPA applied 
Prudential Investment Plan  
PruFund Growth Fund +3.56%
PruFund Risk Managed 4 Fund +5.33%
PruFund Risk Managed 5 Fund 
+3.67%
Trustee Investment Plan 
PruFund Cautious Pension/ISA Fund +2.00%
PruFund Growth Pension/ISA Fund+3.91%
PruFund Risk Managed 2 Pension/ISA Fund +2.09%
 PruFund Risk Managed 3 Pension/ISA Fund +3.22%
 PruFund Risk Managed 4 Pension/ISA Fund  +2.67%
Prudential ISA 
PruFund Cautious Pension/ISA Fund +2.00%
PruFund Growth Pension/ISA Fund +3.91%
PruFund Risk Managed 2 Pension/ISA Fund +2.09%
PruFund Risk Managed 3 Pension/ISA Fund +3.22%
 PruFund Risk Managed 4 Pension/ISA Fund  +2.67%
PruFund Risk Managed 5 Pension/ISA Fund +3.45%
Prudential Retirement Account – Series D 
PruFund Cautious Pension Fund – Series D+2.00%
 PruFund Growth Pension Fund – Series D+3.91%
PruFund Risk Managed 2 Pension Fund – Series D+2.09%
 PruFund Risk Managed 3 Pension Fund – Series D  +3.22%
PruFund Risk Managed 4 Pension Fund – Series D   +2.67%
Flexible Retirement Plan 
PruFund Cautious Pension/ISA Fund+2.00%
PruFund Growth Pension/ISA Fund +3.91%
PruFund Risk Managed 2 Pension/ISA Fund +2.09%
PruFund Risk Managed 3 Pension/ISA Fund +3.22%
PruFund Risk Managed 4 Pension/ISA Fund +2.67%
International Prudence Bond / Prudential International Investment Bond 
PruFund Cautious (Sterling) Fund +2.00%
PruFund Growth (Sterling) Fund+2.88%
PruFund Growth (Dollar) Fund+2.95%
PruFund Growth (Euro) Fund+2.68%

Please note UPAs also apply to the protected versions of the fund where applicable.

On the monthly PruFund Investment Date, a UPA is applied if the unsmoothed price is:

  • 4%, or more, higher than the smoothed price, for our PruFund Cautious, PruFund Risk Managed 1 or PruFund Risk Managed 2 funds, or
  • 5%, or more, higher than the smoothed price for our PruFund Growth, PruFund Risk Managed 3, PruFund Risk Managed 4 or PruFund Risk Managed 5 funds.

Growth rates aren’t guaranteed. The value of an investment can go down as well as up. Your client may get back less than they have paid in.

More information on the EGRs and UPAs for each product is available on PruAdviser.

Prudential have said that they have had a strong 6 month performance since the 25th November last year.  It’s important to note that PruFund funds lag both a rising and a falling market.  The increases or reductions in PruFund via UPAs are formulaic and non-discretionary.  They are based on the maths and the difference in fund value between the underlying assets and the ‘smoothed’ price.

M & G’s Treasury & Investment Office (TIO) who manage PruFund for Prudential are in the middle of a Strategic Asset Allocation review.  Within the next month or two we will find out how they change their assets focusing on long term returns.

The Expected Growth Rates (EGRs) have remained the same.  For example on PruFund Growth 5.70% gross per annum.  EGRs give you an indication of what the TIO think long term returns will be over 15 years plus.

These upwards Unit Price Adjustments are some very positive news and demonstrate the recovery in the markets as a whole. These UPAs combined with previous UPAs over the past 12 months have brought the majority of the PruFund range of funds back to positions similar to those before the drops caused by the Coronavirus Pandemic.

Hopefully this trend of recovery and positive performance continues as we see mass vaccine rollouts worldwide and lockdown restrictions gradually eased. Although we may not be out of the woods yet and there are no guarantees, this increase in the UPAs is a reason for optimism.  

Take care.

Paul Green DipFA

26/05/2021

Team No Comments

Brewin Dolphin – Markets in a Minute

Please see below the latest ‘Markets in a Minute’ article from Brewin Dolphin received late yesterday afternoon – 25/05/2021

Stocks mixed as Fed hints at asset purchase taper talks

Global equities were mixed last week as investors weighed signs of an economic rebound in Europe against the Federal Reserve’s so-called ‘taper talk’.

The S&P 500 and the Dow fell 0.4% and 0.5%, respectively, after minutes from the Fed’s April policy meeting suggested it might start to discuss reining in its accommodative monetary and fiscal policy. The Nasdaq added 0.3% after Friday’s flash US composite PMI output index surpassed expectations.

Over in Europe, signs that the economy is rebounding helped the pan-European STOXX 600 end the week up 0.4%, although gains were held back by concerns about rising inflation. The UK’s FTSE 100 slipped 0.4% as inflation surged and the pound rose against the dollar.

Japan’s Nikkei 225 added 0.8% on higher-than-expected export growth and a surge in manufacturers’ business confidence. China’s Shanghai Composite lost 0.1% as retail sales growth slowed and cases of Covid-19 rose in several provinces.

Equities rebound as tech shares outperform

Stocks recovered some of last week’s losses yesterday as inflation fears receded and technology shares rose.

The tech-heavy Nasdaq was up 1.4% at Monday’s close, while the Dow rose 0.5%, led by Microsoft, Cisco, Apple and Intel. The S&P 500 added 1.0%, with the communication services, information technology and consumer discretionary sectors outperforming.

Gains in technology stocks also boosted stocks in Europe, although several markets were closed for Whit Monday. The pan-European STOXX 600 was up 0.1% and France’s CAC 40 added 0.4%. The FTSE 100 climbed 0.5% to 7,052 as the pound stabilised following a warning from China against excessive speculation in commodities.

The FTSE 100 was down 0.1% in early trading on Tuesday as investors mulled figures that showed UK public borrowing in April was the second highest on record. At £31.7bn, it was £15.6bn less than in April 2020, when the government borrowed £47bn to tackle the pandemic. It was also lower than the Office for Budget Responsibility’s forecast of £39bn.

Fed officials discuss potential taper talk

Minutes from the Federal Reserve’s meeting in late April, released last Wednesday, reflected an overarching dovish sentiment but suggested some Fed officials thought the US central bank should start talking about tapering asset purchases relatively soon.

“A number of participants suggested that if the economy continued to make rapid progress toward the committee’s goals, it might be appropriate at some point in upcoming meetings to begin discussing a plan for adjusting the pace of asset purchases,” the minutes said.

Currently, the Fed is buying $120bn of Treasury securities and agency mortgage-backed securities each month. It has pledged to continue at this pace until it sees “substantial further progress” towards its inflation and employment targets. The meeting was held before inflation data showed a surge in the US consumer price index for April.

Elsewhere, figures released on Friday showed IHS Markit’s flash US composite output index reached a record high of 68.1 in May – well above April’s reading of 63.5 and higher than the consensus forecast. The services business activity index reached 70.1 in May, up from 64.7 in April, marking the fastest pace of growth on record. The manufacturing PMI also rose to 61.5 from 60.5 the previous month.

UK jobs market is picking up Last week’s employment data showed the UK labour market is picking up. The number of payrolled employees increased by 97,000 between March and April, the fastest pace since the start of the pandemic. Overall, there were 28.3m payrolled employees in April 2021, which was 257,000 fewer than 12 months ago.

The UK unemployment rate unexpectedly fell to 4.8% for the three months to March, down from 4.9% in February, while the number of job vacancies hit the highest level since the start of the pandemic. Median monthly pay increased by 9.8% year-on-year and is now higher than pre-coronavirus levels.

The labour market data was released the day before figures showed the annual rate of inflation in the UK more than doubled in April to 1.5% from 0.7% in March. Higher petrol prices and gas and electricity bills drove the increase.

Eurozone business activity soars

Business activity in the eurozone grew at its fastest pace in more than three years in May as Covid-19 restrictions were eased. IHS Markit’s flash composite eurozone PMI rose to 56.9 from 53.8, the highest reading since February 2018 and the third successive month of output growth. The services sub-index increased to 55.1 from 50.5, while the manufacturing sub-index came in at 62.8, down slightly from 62.9 in April. All three readings were above analysts’ expectations.

The research also showed new order growth surged to the highest since June 2006, resulting in backlogs of uncompleted orders rising to a degree not surpassed since the series began in November 2002. IHS Markit said this underscored “the growing shortfall of current output relative to demand”. Meanwhile, the roll out of the vaccine meant optimism about the year ahead was the brightest since comparable data began in 2012.

Please continue to check back for our latest blog posts and market updates.

Charlotte Ennis

26/05/2021

Team No Comments

Legal & General Investment Managers – Market Commentary

Please see below latest input from Legal & General’s Investment Managers Asset Allocation team outlining their views on markets:

I think the above article helps highlight just how volatile Cryptocurrencies are and also how very concentrated ownership of these assets are. These assets are extremely speculative and caution is advised before investing (gambling?).

Emerging Markets Debt looks like an asset class that could help add value to a portfolio over the long-term, but Currency risk needs to be factored in.

It remains to be seen whether the current bout of inflationary pressure are transitory or longer-term and when Central Banks might intervene to help curb inflation.

Recession was something talked about pre-pandemic, with the consensus from Fund Managers being that we were in late cycle, with a little room for growth. It’s hard to tell where the recession risk lies now given the impact of the Pandemic, but L&G’s Asset Allocation team see this as an issue that is at least 2 or more years away now.

Please continue to check our Blog content for advice and planning issues and the latest investment, markets and economic updates from leading investment houses.

Please keep safe and healthy.

Carl Mitchell – Dip PFS

IFA and Paraplanner

25/05/2021

Team No Comments

Why stock markets are worried about inflation

Please see below article received from AJ Bell yesterday morning, which provides a cautionary commentary on the historic effects of inflation and dissects current market behaviour.

Even a reading of 1.5% inflation in the UK’s consumer price index is giving stock markets the jitters, although that it still a very, very, very long way below the sort of levels which gave investors terrible trouble in the 1970s and early 1980s.

Back then inflation, as measured by the retail price index (for which there is a longer dataset), was roaring away in the twenties. That hurt consumers’ spending power, as their savings lost value in real terms, and dissuaded companies from investing, as the returns on any new projects could not compete with the double-digit interest rates on offer.

Yet the experiences of the 1970s clearly have stock market investors on their guard.

The FTSE All-Share rose by a perfectly respectable 56% in the 1970s, but the retail price index rose by 248%, so equities did not offer as much protection as hoped. Gold did, since the precious metal surged by nearly 1,400%.

Equities came into their own in the 1980s and 1990s as inflation ebbed, interest rates came down and lower returns from cash and bonds persuaded investors to gravitate toward stocks. Gold all but disappeared from view, only to reappear as Governments began to shake the magic money tree in response to the Great Financial Crisis and then came to view such shaking as standard operating procedure in the 2010s and early 2020s.

Investors will also know that the real damage to equity portfolios was done in the late 1970s, when a second wave of inflation hit home, after the appalling state of the UK’s public finances finally caught up with it.

That was also when gold really came into its own, as investors shunned cash and paper assets in favour of ‘real’ assets.

That sequence of events supports the analysis proffered by Jens O. Parrson in his book Dying of Money who studied the surge in American inflation in the 1970s with the even more dramatic surge in Germany in the 1920s:

‘Everyone loves an early inflation. The effects at the beginning of an inflation are all good. There is steepened money expansion, rising government spending, increased government budget deficits, booming stock markets and spectacular general prosperity, all in the midst of temporarily stable prices. Everyone benefits and no-one pays. That is the early part of the cycle. In the later inflation, on the other hand, the effects are all bad. The government may steadily increase the money inflation in order to stave off the later effects, but the later effects patiently wait. In the terminal inflation, there is faltering prosperity, tightness of money, falling stock markets, rising taxes, still larger government deficits and still roaring monetary expansion, now accompanied by soaring prices and ineffectiveness of all traditional remedies. Everyone pays and no-one benefits. That is the cycle of every inflation.

Economists, investors, consumers, savers and above all central bankers will be hoping that Parsson is wrong.

But no-one can ignore how the early building blocks of Parsson’s argument are in place – money supply is rocketing in the US, UK, Europe and Japan; Government deficits are off the clock as they spend like fury to stave off the economic after-shocks posed by the pandemic; asset prices are surging; and calls for yet more spending and stimulus are much louder than those for a scaling back of either fiscal or monetary stimulus. Faith in the existence of a magic money tree that can dispense wealth without consequence is running high.

And yet no central banker can pretend we are in a normal situation or that they are in control. Policies described as emergency measures in 2008-09 are now the norm, as interest rates remain anchored at record lows and Quantitative Easing programmes continue to run at full tilt. Any attempts to row back on those policies prompt financial market volatility and a rapid spill-over in to the ‘real’ economy, as we saw in 2018 and 2019. Global debts continue to accumulate, providing only the weakest of foundations for any economic recovery and ones that are prone to quickly buckling, as we saw globally in 2007-09, in 2011-13 in Southern Europe and around the world again in 2021. Annual Government budget deficits stand at their highest level since the 1940s in many cases and aggregate deficits are in many cases setting new all-time highs on a monthly basis.

Meanwhile, stock markets, cryptocurrencies, non-fungible tokens continue to surge, or at least do so until the threat of rising interest rates, less QE and a drop in the amount of free money with which to idly speculate raises its head once more.

No-one knows what is coming next – inflation, deflation or even stagflation – and investors cannot afford to be too dogmatic about their portfolio allocations, as the three different outcomes require a different response from investors as they seek to augment or at least protect their wealth.

If history is any guide, equities offer some protection against inflation, but with a focus on pricing power, life’s essentials and raw materials. Bonds and cash, both of which are to be avoided in an era of inflation or stagflation, would help in a deflationary environment. And in the case of stagflation, index-linked cash flows such as rents from property, infrastructure projects and index-linked bonds would help, as would gold, at least if the experience of the 1970s is repeated.

Investors therefore need to be prepared for anything with a balanced portfolio that covers all eventualities, because the ultimate outcome is just too hard to predict and also because valuations will reflect different market views at different times.

Just over a year ago, the prospect of inflationary surge was seen as very unlikely and bonds were doing well, shares were doing badly and gold was being completely ignored.

Now, the consensus view is that inflation is indeed coming, as evidenced by how well mining shares and commodity prices have done and sharp falls in bond prices and rapid increases in Government bond yields (albeit from a low base).

Perhaps it is therefore time to start wondering whether it is time to go against the crowd once more.

We will continue to publish relevant content, market analysis and news. Please therefore, check in again with us soon.

Stay safe.

Chloe

24/05/2021

Team No Comments

Four truths about inflation and the Fed

Please see the below article from Invesco received late yesterday afternoon:

Key takeaways

The Fed does not have a trigger finger

Just because the Fed reacts negatively to a data point doesn’t mean it’s going to tighten monetary policy at its next meeting.

Some inflation is expected

Time and again, Fed officials have warned that a spike in inflation is likely as the US economy re-opens.

The Fed’s approach has changed

The Fed has gone through a paradigm shift when it comes to inflation targeting.

Last week, investors shuddered as data showed a big rise in prices in the US and a greater-than-expected rise in prices in the eurozone. Stocks sold off, US Treasury yields climbed higher, and market pundits obsessed over inflation. I feel it’s important at this juncture to remind investors of a few truths surrounding inflation and the Federal Reserve.

1. The Fed does not have a trigger finger

Just because the Fed reacts negatively or says it’s surprised by one or more data points doesn’t mean it’s going to tighten monetary policy at its next meeting. Some investors were taken aback by Fed Vice Chair Richard Clarida’s comments last week when he said he was surprised by some recent data points such as the Consumer Price Index, which was much higher than he expected. However, he was quick to reassure: “Honestly, we need to recognize that there’s a fair amount of noise right now, and it will be prudent and appropriate to gather more evidence…” Don’t forget that the Fed’s new catch phrase is “patiently accommodative.” In other words, the Fed is going to err on the side of accommodation and is likely to deliberate extensively before tightening.

2. The Fed anticipates a spike in inflation as the economy re-opens

At a Wall Street Journal conference in early March, Fed Chair Jay Powell explained that, “We expect that as the economy reopens and hopefully picks up, we will see inflation move up through base effects. That could create some upward pressure on prices.” In fact, time and again, Powell and other Fed officials have telegraphed that a spike in inflation is likely as the US economy re-opens. The Fed is ready and accepting of that rise in inflation.

3. We won’t know any time soon if the increase in inflation is temporary or persistent

A temporary rise in inflation is at least partially the result of base effects — in other words, the comparisons to a year ago look distorted given what poor shape the economy was in last spring as the pandemic took hold. In addition, there is currently a mismatch between supply and demand which can drive up prices — think of the supply chain issues that are being experienced right now in some industries and the pent-up demand that is now being exercised as economies re-open. However, these are likely to create only temporary inflation. After all, how many flights can you take and haircuts can you get once the economy re-opens? Clearly, the law of diminishing marginal utility suggests that at a certain point, satisfaction with each additional flight or haircut is reduced.

Now, there are forces that can lead to more persistent inflation. Typically wage increases lead to “stickier” inflation. We have not yet seen a significant rise in average hourly earnings in the United States, and it seems unlikely that will happen quickly given the very substantial amount of labor market slack.

Monetarists would argue that it all comes down to money supply; a significant increase in money supply can spur persistent inflation, and right now we have seen a very significant increase. However, one other key ingredient is usually present as well: an increase in the velocity of money, which we have not yet seen. The quantity theory of money posits that inflation is not just a function of money supply but also the velocity of money. As the St. Louis Fed explained in a brief research note, “If for some reason the money velocity declines rapidly during an expansionary monetary policy period, it can offset the increase in money supply and even lead to deflation instead of inflation.” But even if a money supply increase is enough to spur persistent inflation, this would not occur immediately — it usually occurs with an 18-24 month lag, suggesting we may not see it until late 2021 or early 2022.

4. The Fed’s inflation targeting policy represents a paradigm shift for the Fed

The Fed has gone through several paradigm shifts in the last several decades, and they’ve been transformational. I’m old enough to remember when the Fed didn’t believe in regular communication with the public, when the size of then-Fed Chair Alan Greenspan’s briefcase was the best indicator of what the Fed’s decision on rates would be at the next Federal Open Market Committee (FOMC) meeting. And now of course, the Fed is extremely transparent, working hard to telegraph its views and actions before taking them. Similarly, the Fed had a very different inflation targeting policy before last summer. Its current policy, called Average Inflation Targeting (AIT), means that the Fed’s objective is to push inflation enduringly above 2% and attain full employment before considering tightening. In other words, this new policy enables the Fed to be far more flexible and essentially tolerate economic overheating. This is NOT the Fed of yesteryear, which believed that its role was to take away the punch bowl just as the party was getting started. This Fed might leave out the punch bowl into the wee hours, even as partygoers get drunk.

What does this mean for investors?

This begs the question: what are investors afraid of? Are they afraid of inflation — or the Fed tightening in reaction to inflation? It seems to me that they are far more worried about the latter than the former. That would explain why last week’s negative reaction to signs of inflation was so very short-lived, as Fed officials provided reassurance. And so perhaps investors should be more concerned about the former, especially if the Fed remains “behind the curve” and is unable to easily tame inflation once it tries to. While I must stress that this is far from my base case scenario, it is a risk that needs to be considered since inflation can have a negative impact on some asset classes. If persistently higher inflation were to occur, investors could benefit from exposure to commodities, cyclical stocks, inflation-protected securities, emerging market assets and even dividend-paying stocks as part of a diversified portfolio.

This week there is more potential for volatility, as investors wait with bated breath for the FOMC minutes, which could offer more insight into what the Fed is thinking with regard to inflation and tightening.

Our Comments

The markets are still volatile at the moment but are generally on an upwards trend as you can see from the below chart of the FTSE 100 over the past year:

Source: Google, as at 16:35 BST 19/05/2021

Global markets are increasingly more interconnected and US inflation fears affects the UK markets (and vice versa).

Inflationary fears will continue as will the volatility however as we always state, its important to remain calm and ride the volatility out.

Andrew Lloyd

20/05/2021

Team No Comments

Brewin Dolphin – Markets in a Minute

Please see below the latest ‘Markets in a Minute’ article from Brewin Dolphin received late yesterday afternoon – 18/05/2021

Stocks slide as higher inflation sparks fears of rate hike

Global stock markets fell last week after a surprise surge in US inflation sparked fears of higher interest rates.

US stocks slipped from record highs, although a rally later in the week helped to moderate losses. The S&P 500 fell 1.4%, the Dow declined 1.1%, and the Nasdaq slid 2.3% as technology and growth stocks bore the brunt of interest rate jitters.

European indices were mixed. Germany’s Dax was largely flat, Italy’s FTSE MIB gained 0.6% and the pan-European STOXX 600 declined 0.5%. The UK’s FTSE 100 slid 1.2% as the pound rallied against the US dollar following local election victories for the Conservatives.

In Japan, where Covid-19 infection rates are accelerating, the Nikkei slumped 4.3% on news that a state of emergency will be declared in three more prefectures. In contrast, the Shanghai Composite rose 2.1% following a 6.8% surge in China’s producer price index – the largest gain since 2017.

Indian variant sparks lockdown easing fears

UK and European stock markets extended losses on Monday as the spread of a Covid-19 variant first identified in India raised concerns about the relaxation of lockdown measures.

On 17 May, lockdown restrictions were eased in England, Wales and most of Scotland, but prime minister Boris Johnson warned that “we must take this next step with a heavy dose of caution”. He said the Indian variant could make the next step of easing, due on 21 June, more difficult. The FTSE 100 ended the session down 0.2%, while Germany’s Dax slipped 0.1%.

Markets in Asia were mixed on Monday amid a raft of economic data from China. Industrial output grew by 9.8% year-on-year in April, in line with expectations, while retail sales grew by 17.7%, far worse than the 25.0% forecast. The Shanghai Composite added 0.8%, whereas Japan’s Nikkei fell by 0.9%.

Inflation fears persisted on Wall Street, sending the Nasdaq down 0.4%. The S&P 500 and the Dow shed 0.3% and 0.2%, respectively.

The FTSE 100 was up 0.5% at Tuesday’s open after data from the Office for National Statistics showed the UK unemployment rate fell again between January and March to 4.8%.

US core inflation jumps 0.9% in April

Inflation dominated the news headlines last week. The latest US consumer price index (CPI) revealed core inflation (excluding food and energy) jumped by 0.9% in April. This was the biggest monthly rise in nearly four decades and far higher than the 0.2% rise economists were expecting. The headline CPI increased by 4.2% on an annual basis, exceeding the 3.6% forecast.

On Wednesday, Federal Reserve vice chair Richard Clarida acknowledged that he was surprised by the jump in consumer prices, but said he still expects the increase to be temporary. He added that the previous week’s disappointing jobs growth report proves the ‘wisdom’ of keeping monetary policy loose.

Last week also saw the release of the latest US retail sales data, which showed sales unexpectedly stalled in April as the boost from stimulus cheques faded. Economists had been expecting a rise of between 0.8% and 1.0% from the previous month. However, the increase came after a 10.7% surge in March, an upward revision from the previously reported 9.7% increase.

Economy recovering in Europe

Rising vaccination rates and the prospect of the easing of lockdown restrictions prompted the European Commission to increase its economic growth forecasts for the next two years. The euro area is expected to grow by 4.3% in 2021 and 4.4% in 2022, up from the previous forecast of 3.8% for both years. The broader EU economy is expected to grow by 4.2% in 2021 and 4.4% in 2022.

Meanwhile, the rapid roll out of the vaccine boosted UK gross domestic product (GDP) by a stronger-thanexpected 2.1% in March, the fastest monthly growth rate since August 2020. This helped to reduce the rate at which the economy contracted in the first quarter to 1.5%. However, March’s GDP was still 5.9% below the level seen in February 2020.

Chinese producer prices surge in April

Over in China, factory gate prices rose at the fastest pace in three-and-a-half years in April as raw materials prices surged. The producer price index jumped 6.8% from a year earlier, following a 4.4% increase in March. The consumer price index (CPI) rose by a less-than-expected 0.9% because of lower food prices.

Separate figures showed auto sales surged 8.6% in April from a year ago, marking the 13th consecutive month of growth, according to the China Association of Automobile Manufacturers. This means the country’s vehicle market has now fully recovered to pre-pandemic levels. In the first four months of 2021, new vehicle sales surged by almost 52%.

Weekly updates like these from Brewin Dolphin help us keep up to date with that is happening in the markets.

Please continue to check back for our latest blog posts and market updates.

Charlotte Ennis

19/05/2021