Please see the below article received from JP Morgan this morning:
‘In our view regulatory interventions will increase, and these interventions will underpin carbon prices not only in Europe, but also globally.’ – Vincent Juvyns
European policymakers have been focused on tackling climate change for many years. The launch of the European Union’s (EU’s) Emission Trading System (ETS) in 2005, the first carbon market in the world, has been the cornerstone of the bloc’s policy efforts. Since then, the ETS has been upgraded several times to reflect the EU’s growing climate ambitions and changes are now accelerating further since the EU has agreed to reduce its greenhouse gas (GHG) emissions by at least 55% by 2030. These regulatory initiatives at least partly explain why prices for CO2 emissions allowances in Europe have recently reached an all-time high of 56 euros per tonne of carbon dioxide equivalent (tCO2e).
The EU’s example is being increasingly copied, with several individual countries launching their own emission trading systems. At present, global carbon prices remain well below those seen in Europe. If they fail to move in line with what the EU deem to be acceptable, the subject of carbon taxes at the EU border will be an increasing reality. This is why we believe investors should be aware of the impact of higher carbon prices on their portfolio.
What drives carbon prices? Europe case study
There are two main types of carbon pricing mechanisms: a carbon tax, which is the most direct way to set a price on carbon, but which doesn’t set a pre-defined emission reduction target; and an emissions trading system, which caps the total level of GHG emissions, but doesn’t set a pre-defined price.
The EU chose the second approach when it created its ETS in 2005. The EU’s ETS is the world’s first and also the largest emissions trading system as it covers 45% of the EU’s GHG emissions produced by three sectors within the European Economic Area: electricity/heat generation, energy-intensive industry, and commercial aviation.
Companies in these sectors are allocated a free emissions allowance. Those with lower emissions than their allowance can sell their “unrequired” emissions to other companies in the sector (Exhibit 1). The balance between supply and demand for emissions creates a market price.

The EU can influence supply and demand dynamics to raise the carbon price in three ways: by reducing the emissions cap; by increasing the industries subject to the scheme; and/or by reducing the allocation that is deemed free.
In its recent directive, the EU decided that the aggregate emissions cap will fall by 2.2% per year from 2021 onwards (vs. 1.74% before). The EU is still deciding whether to include new sectors, such as transportation and buildings. The percentage of free emissions allowances, which had already fallen from 80% in 2005 to 43% in 2020, is to gradually decrease to 30%.
As a result, while some of the recent surge in the carbon price may reflect strong demand for emissions allowances as firms meet rising demand, there is a structural underpinning to higher carbon prices from regulatory interventions.
The balancing act between internal drive and external competition
EU authorities are mindful of the delicate balancing act they face between meeting domestic climate ambitions while at the same time not damaging corporate profitability and competitiveness compared to international competitors that are not subject to similar regulatory standards. Encouraging international peers to keep up with the EU’s efforts is bearing some fruit: other regions are beginning to launch their own emissions trading schemes and 25% of global GHG emissions are now covered by carbon pricing initiatives compared to just 5% in 2005 (Exhibit 2). However, the carbon price in these regions is much lower than in Europe (Exhibit 3).
Coverage of global emissions trading schemes and the impact on carbon prices
Exhibit 2: Global emissions covered by carbon pricing initiatives
% of global greenhouse gas emissions

Exhibit 3: Emissions trading system prices
USD per tonnes of CO2 equivalent
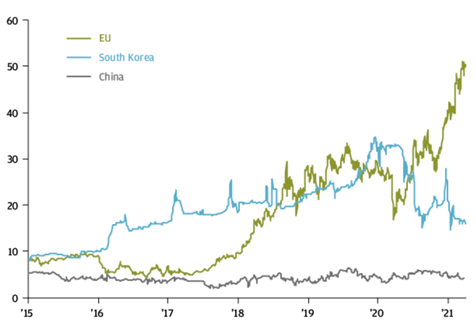
Carbon prices internationally are not only lower than those in the EU, they are also below those required to meet the global climate objective of reaching net zero emissions by 2050 according to many climate scientists and policymakers. Although the estimate is wide, a range of between USD 40 and USD 80 per tCO2e is often argued as necessary to limit global warming to less than 2°C.
Carbon prices will no doubt be a key topic of conversation when global leaders convene at COP26 in November. If the EU, China and the US cannot agree on a path towards a common carbon price, the EU may need to find a short-term solution to ensure that its climate efforts do not disadvantage European businesses.
One solution that appears to be growing in appeal is a carbon border adjustment mechanism (CBAM). This import tariff would be designed to ensure that the environmental footprint of a product is priced the same whether it is manufactured locally or imported. The CBAM is one of the key measures discussed as part of the EU’s Green Deal. The proceeds of the tax would form part of the EU’s budget, which would be used to finance the EU’s recovery and green transition.
At this stage the CBAM is a threat to international peers, but the credibility of that threat has been strengthened given the legislation that would be required has been approved by the European Parliament. It is now up to the European Commission to decide whether to use it.
Investment implications
In our view regulatory interventions will increase, and these interventions will underpin carbon prices not only in Europe, but also globally. The result will be an increase in the cost base of companies in a growing number of sectors.
One of the key investment implications is that increased business costs may serve to raise consumer prices, adding to growing inflationary pressures from loose monetary and fiscal policies. If firms are unable to pass on higher costs the higher carbon prices may dent profitability.
If the CBAM is activated, companies that export a lot of their carbon-intensive products to the EU may suffer from higher carbon prices, even if their home country does fairly little in terms of carbon regulation. The price of carbon is therefore a risk that needs to be monitored.
On top of traditional financial analysis, investors may look to evaluate non-financial parameters, such as the carbon intensity of companies, as we believe that minimising the carbon intensity of a portfolio should help improve its risk/return profile over the long term. This is what we have already observed over the last couple of years when comparing the MSCI World index with the MSCI World Climate Change CTB Select, a Climate Transition Benchmark under the EU Benchmark Regulation, which reweights securities based upon the opportunities and risks associated with climate transition risks.
Indeed, the MSCI World Climate Change CTB Select Index has a Weighted Average Carbon Intensity (which represents the number of metric tonnes CO2 equivalent emissions per USD million enterprise value including cash) that is almost 40% lower than the MSCI World Index, while it has also outperformed the latter by 150 basis points since its inception in November 2013, and has a better Sharpe ratio over the last three and five years.
With global carbon prices set to increase further in the future, minimising the GHG emissions of a portfolio should not only contribute to the fight against global warming, but it should also lead to better risk-adjusted returns in the long run.
Please continue to check back for a range of blog content, from ESG focused pieces like this one to market updates and insights from a variety of the worlds’ leading investment houses.
Andrew Lloyd
01/06/2021