Please see below article recently received from AJ Bell, which warns of the potential impact that tax relief reform could have on pensions and investors.
Recent press reports suggest the Treasury is eyeing cuts to pension tax incentives to help pay the cost of COVID. Reforms said to be under consideration include introducing a flat rate of pension tax relief, cutting the lifetime allowance or taxing employer contributions.
Beyond the political fire and brimstone a pensions tax raid would cause among Conservative backbenchers and voters, there would be significant practical implications for any of the proposals floated by the Treasury.
Cutting tax relief for individuals risks undoing the groundwork laid by automatic enrolment and sowing mistrust in the stability of the retirement savings framework.
Hitting employers, meanwhile, might raise a fast buck for the Chancellor but would risk strangling off the UK’s pandemic recovery.
There were always going to be tough fiscal choices as the country slowly shifts away from dealing with the health emergency of Coronavirus and focuses on the financial hole blown in the Exchequer’s balance sheet.
It is critical any proposals for pension tax reform consider both short and long-term priorities, and in particular the challenge of ensuring current and future generations’ retirement prospects are not fatally damaged.
Introducing a flat rate of pension tax relief
Given the priority of the Government is to raise cash for the post-COVID economic recovery, a flat rate of pension tax relief would likely need to be set well below 30% to achieve this.
In fact, analysis carried out by the respected Pensions Policy Institute* suggested setting a flat rate of pension tax relief at 30% would actually cost the Government money, while a rate of 25% might save between £2-£3billion a year and 20% around £6-£8 billion a year.
Such huge savings would clearly come at a cost to individuals. For example, if a flat rate of 20% was introduced, a 35-year-old earning £60,000 and paying 4% of salary into a pension could miss out on £50,000 of retirement income by the time they are 67. Those earning more or making larger contributions would face an even bigger hit to their plans.
However, the big challenge in going down this road – both practically and politically – lies in the public sector, where some workers continue to enjoy generous guaranteed defined benefit pensions.
In order to apply a flat rate of relief to these pensions a tax charge would need to be calculated and applied directly to employees by HMRC.
Doctors and senior NHS staff who have been on the front line dealing with the pandemic would likely end up with tax bills running into thousands of pounds as a result.
Reduce the pensions lifetime allowance from £1,073,100 to £900,000 or £800,000
The lifetime allowance has been tinkered with relentlessly by successive Governments, reducing from £1.8 million a decade ago to just £1 million by 2016/17. Two years later it was pegged to CPI inflation – but this link was removed for the rest of this Parliament by Rishi Sunak in March. This constant tinkering has led to huge complexity and uncertainty for retirement savers.
If we were to get yet another cut to the lifetime allowance to £900,000 or even £800,000, as has been suggested, more diligent savers would be at risk of breaching the limit.
To put this in context, reducing the lifetime allowance to £800,000 would mean after tax-free cash has been taken the retirement income someone could take at age 66 would be well below the average salary in the UK.**
This would feel like an extremely low bar to set for people’s retirement aspirations.
Tax employer pension contributions
Of the pension tax proposals floated this was the one with the least amount of detail attached – which is saying something.
At the moment employer pension contributions are exempt from National Insurance, so it is theoretically possible the Treasury could reverse this position – or perhaps apply a limited charge – in a bid to raise revenue.
However, going down this road would cause uproar among businesses already struggling to deal with the fallout from the pandemic. It could also be counterproductive if landing these firms with extra costs forced them to hold off on investment.
Over the long-term, any increase in the costs of providing pensions would likely see a damaging levelling down of provision.
Comment
Pension tax reliefs have been under review since Gordon Brown was the Chancellor in 1997, remember his tax raid? Every government looks at them.
Whilst changing tax reliefs could save money for the State, we need to look at the bigger picture. What would be the impact on pension savings? If people save less in pensions, they will rely more on the State. This is not what any government wants.
I think tinkering with employer pension contributions tax relief would be particularly damaging. Employers need to help fund employee’s pensions.
Hopefully, we won’t see any change in this area, but we also know that we need money now too to support the country in key areas, covid debt interest payments (long term repayment?), to re-build the NHS/Social Services/Residential Care etc., and to help kick start the economy in the UK.
The other issue is timing, Rishi Sunak needs all of us to go out and spend money now to help the economy recover. He can’t scare us into not spending, we will fall back into recession.
Please see the below article from Invesco received yesterday evening:
Key takeaways
Structural changes post-Covid are diminishing the global deflationary narrative
At the same time, a combination of fiscal and monetary largesse are providing a new inflationary force
We believe cyclically sensitive stocks and European stocks in particular could benefit from this new regime
One of the most significant top-down discussions impacting asset prices (bonds and equities) today is inflation: are we heading into a period of inflation or not? The debate has been rumbling since the policy reaction to the Covid pandemic but is now reaching fever pitch as we’ve seen the first above trend inflation data.
As European equity investors, we believe we must have a view. While it would be nice to simply claim that we’re ‘bottom-up’ and ‘fundamental’, the fact is we can’t ignore the polarisation in markets of the last decade, underpinned by monetary dominance and fiscal repression.
Duration (defensive/Quality) assets have benefitted from the low inflation period and short duration assets (cyclical/Value) have suffered. This part is straightforward to understand: medium-term inflation influences the risk-free rate (RFR) and it’s the RFR that the market uses to discount future cash flows. If expectations are for sustained low inflation, then the discount rate is low and asset prices rise and vice versa.
The problem is that forecasting medium-term inflation isn’t straightforward. Nothing causes normally amiable economists to become more tribal than asking them to explain the causes of inflation. In this article, we explain why we believe the arguments for transitory inflation are something of a distraction and point to areas of the market that could do well as mid-term inflation emerges.
Monetarists vs Keynesians and the case for transitory inflation
Monetarists can ‘prove’ inflation is a consequence of broad money growth while Keynesians will eloquently explain that as the demand curve shifts (to the right) faster than the supply curve, then prices rise.
Given we can’t even agree on the definitive cause of price moves then it’s not surprising there’s debate at any moment in time as to what the price moves might be.
The Monetarist vs Keynesian arm wrestle has, we believe, become more visceral since the global financial crisis (GFC) because excess money supply hasn’t led to significant inflation1. This has empowered the Keynesians to look for other rational reasoning of deflationary forces such as demographic trends (declining workforce), technology (increased productivity and labour marginalised) and globalisation (lower cost supply) with post crisis austerity the final straw.
Accordingly, when looking at the post-Covid world, Monetarists have less voice and the Keynesians argue these same three structural trends persist and, hence, any inflation we are seeing today is purely transitory.
This transitory narrative is a function of the severity of the enforced downturn which has impeded but, importantly, not destroyed supply (capital still exists). Therefore, as demand has recovered (surprisingly) fast, supply is temporarily struggling to cope and prices have risen, if only temporarily.
The effects have been exacerbated by the Suez blockage, lack of belly capacity in air transport, low inventories and even the weather in Texas.
If one believes that inflation is ‘only transitory’, logic dictates that it won’t impact the discount rates and therefore duration assets aren’t at risk and short duration cyclicality assets remain value traps….
Time to address the long-term deflationary narrative
The irony is that transitory inflation believers would likely claim to be long term and not worry about the short-term noise. However, we believe they’re perhaps missing the more fundamental structural changes happening post Covid.
We will try to outline why and in doing so will intertwine both economic theories, which we appreciate may anger more purist economists.
Firstly, we need to address some of the structural deflationary points:
Demographics. These are hard to argue with. European demographic trends are unhelpful albeit, net of migration, the data to 2019 suggest population is broadly stable. An aging population likewise doesn’t help. To us it remains an ongoing pressure but not incrementally so.
Technology. Often touted as a deflationary force. It increases productivity and hence pushes the supply curve to the right (we can produce more for lower prices). However, importantly, this is nothing new, innovation has been a relative constant over time. We also wonder if, in the post-GFC period, dominated by monetary policy, corporates were rewarded for ramping shareholder returns (dividends and buybacks) at the expense of investment and so exaggerated the deflationary impact.
Globalisation. We believe this is most contestable as a structural cause of deflation. Transferring production to Asia has undoubtedly been a key deflationary force for at least the past 20 years. China has been both a source of cheap labour and then, through policy, a source of excess production assets. In addition, at times of stress, China has devalued its currency, thereby easing inflationary pressures.
We strongly believe that it’s no longer so obvious. Reaction against the offshoring of US manufacturing jobs to China was a key source of Trump’s appeal. His firmly anti-China policy is one of the few policies the Biden administration has continued to pursue and, with China GDP set to rival the US by 2030, it is unlikely to stop being a vote winner. Within China itself, policy has shifted from emphasising the producer economy towards the consumer with some producing assets being forced to close.
This has been aided by Environmentalism being part of the domestic policy agenda. Lastly, it’s perhaps notable that despite strong domestic wage inflation, and the recent Renminbi appreciation, there’s been no talk of China devaluing – could China actually be exporting inflation?
We should also be aware of emerging market monetary policy setting being more traditional than developed markets currently – it’s developed markets running the largest ever deficits, while China tightens.
Figure 1. The Covid crisis will lead to further de-globalisation
The key point is that these structural deflationary forces, while still present, are a less powerful backdrop than we’ve become accustomed to. Meanwhile, there is the incremental risk from emerging inflationary trends.
Inflationary structural trends – are they here to stay?
Covid has changed voter tolerances, which in turn affects policy. This then has an impact on the economic backdrop and, ultimately, inflation risk.
We believe the true impact of the pandemic goes beyond headline fiscal payments, which are only as inflationary as the next cheque/infrastructure project, and more towards a change in what people truly care about and will vote for.
The post-Covid regime shift is happening to address the issues of Inequality and Climate Change. The vulnerability exacerbated by the health crisis is creating tolerance of big government. Unlike after the GFC, when the response to a financial crisis was fiscal austerity, today the electorate want fiscal dominance. The newly created EU recovery fund, worth €750 billion, is such an example.
Figure 2. Grants and loans from the EU recovery fund (in 2018 prices)
These, we believe, are inflationary forces. Big government is historically a poor allocator of resources compared to the private sector – it curtails supply (the British auto industry in the 1970s is a good example of this).Addressing inequality at a micro level means a greater share of stakeholder profits going to wages rather than to shareholders and management. This would direct resources to lower income earners who have a greater propensity to spend and therefore drive demand.
Inequality at a macro level means infrastructure projects and providing incentives to invest, thereby driving full employment and reducing social scarcity. Full employment as a policy is inflationary.
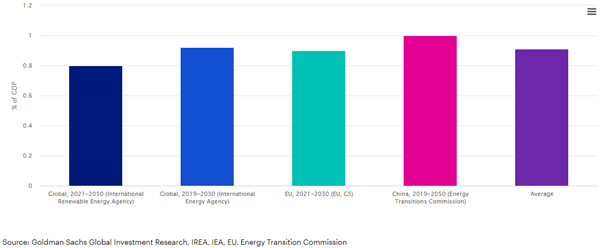
The climate agenda is a wrapper to digest the fiscal shift but it is also inflationary in its own right. Net neutrality requires capital investment: we need to build turbines, solar parks and transmission networks, which creates demand for physical assets.
Figure 3. A rise in green investment demand worth nearly 1% of GDP
However, we also need to build the infrastructure with renewable commodities meaning cement needs to be ‘green’ and steel needs to be low carbon. Some commodity producers will invest and take advantage, but others, previously running for cash, will be forced to close and hence we will finally see capacity come out of the market.
Consumers will be affected too with tolerance for higher prices (especially if wages are increasing) for greener products and replacement demand driven by policy – think replacing vehicles for hybrid or electric alternatives as internal combustion engine (ICE) cars are being banned from urban areas. This is inflationary.
Environmental policy is affecting capital availability already. Financial regulation means asset allocators need to disclose environmental data with the fastest growing asset class being ESG compliant funds.
These fund flows impact corporate capital allocation with environmental projects getting cheaper funding than brown projects. There simply isn’t cheap money available for coal, new oil or other environmentally challenging industries and, hence, over time, there will be a squeeze of supply. We know we are approaching peak oil at some point, however, what happens if peak supply comes first: prices rise – inflationary.
We believe there are some incremental inflationary forces at play, absorbing output gaps. These, combined with the perhaps abating ‘structurally’ deflationary forces will lead to net inflation, but on the condition of monetary complicity.
Monetarists believe money growth is key and MV=PT (or Money Supply times Velocity of money (rate of exchange)) is equal to Prices times Transactions. What does seem to be true is that without money growth, there’s no inflation. Simply because without new money, increased demand growth from, say, Government crowds out private sector demand and so net there’s no growth.
Importantly then, post-Covid, we have both fiscal dominance and monetary accommodation. Post-pandemic, broad money growth has been far greater than following the GFC and we also have a banking system that’s fully functional, i.e. neither deleveraging nor working out bad loans.
Monetary policy makers are shifting their mandate to remain accommodative for longer with targets of full employment and average “synchronised” inflation. This allows developed market central banks to stay ‘behind the curve’, meaning they do not feel the need to address the current inflation scenario.
There’s also consensus that central banks want fiscal cooperation in support of their tired monetary bazookas and will manage the interest costs through yield curve controls if required.
As per the Fischer equation, MV=PT, with ‘V’, the velocity of money, as the balancing item. The ‘V’ is probably best understood as how much the money in the economy changes hands. It has fallen over many years and fell more drastically post Covid as the saving rate has increased. However, we believe ‘V’ will increase as economies unlock, the savings rate falls and inequality falls (lower incomes have a lower propensity to save).
With abundant liquidity meaning banks will be able to lend (even as savings are reduced), central banks printing money and velocity increasing, then prices will rise: inflation.
Transitory inflation is just a distraction – cyclical stocks and Europe set to benefit
We believe that arguing about the short-term transitory inflation numbers misses the key point. Yes, short-term inflation is spiking because of bottle necks. However, asset prices are based on mid-term inflation forecasts, not crisis-related data. Therefore, it’s mid-term inflation we need to think about.
It’s our strong belief that mid-term inflation will be sustained at above central bank targets, albeit not rampant. Indeed, inflation-linked bonds are signalling as much. Yet, the ongoing polarisation of the equity market with preference for long duration and growth equities would suggest something different.
In our view, from a top-down perspective, the types of companies that could benefit from nominal growth are the short duration equities and these are the cheapest parts of the market. We believe they are cheap hedges to the mid-term inflation risk that we have argued for above.
In addition, from a bottom-up perspective, it’s the same sectors and companies that will be a direct beneficiary of the political shifts we’ve mentioned. The environmental agenda is pro-investment; it’s pro-cyclicality.
Companies in industries exposed to construction materials, utilities, automotive OEMs and even banks through volume growth, all might benefit. These are also where currently the most compelling valuations are.
Likewise, the impact from more re-balancing of stakeholder profit shares and fairer taxes with bigger government are less onerous on European companies. This is simply because they have been operating under a more egalitarian environment for longer than other global regions.
Generally, equities are owned with the aim of protecting you from inflation. However, many portfolios that have outperformed over the last decade, and more, have been ones that have benefited primarily from a lack of inflation – so one composed of bonds and long-duration/growth equities.
As we move into a new regime of inflation for the reasons argued, in our view, this type of portfolio is unlikely to do so well. On the contrary, our valuation discipline has resulted in our fund ranges being exposed to short duration or cyclical stocks, which we believe are well positioned in the more inflationary backdrop we have outlined.
Please see below this week’s Markets in a Minute update from Brewin Dolphin – received late yesterday afternoon – 29/06/2021
Stocks surge as US agrees $1trn infrastructure deal
Global equities rebounded last week after Republican and Democratic senators reached a bipartisan agreement on a huge US infrastructure package.
The S&P 500 and the Nasdaq reached new all-time highs, ending the week up 2.7% and 2.4%, respectively. Energy stocks outperformed as supply constraints pushed oil prices to their highest level since October 2018.
The UK’s FTSE 100 rose 1.7% after the Bank of England said that while inflation could reach 3% in the coming months, this would prove to be a temporary phenomenon. This sentiment was echoed by the European Central Bank, which helped to boost the pan-European STOXX 600 by 1.2%.
Over in Asia, Japan’s Nikkei 225 edged up 0.4% as the country’s vaccination drive helped to outweigh a decline in business activity. China’s Shanghai Composite gained 2.3% after the central bank increased its injection of shortterm cash into the financial system for the first time since March amid growing demand for liquidity.
Travel curbs weigh on European indices
UK and European stocks tumbled into the red on Monday (28 June) after Portugal, Spain and Germany introduced new travel restrictions in a bid to limit the spread of the Delta variant of Covid-19. Germany’s chancellor Angela Merkel reportedly urged the EU to designate the UK a ‘country of concern’ and introduce stricter quarantine measures for British travellers.
The FTSE 100 finished Monday’s trading session down 0.9%, with shares in British Airways owner IAG, travel company TUI and budget airline easyJet all falling by more than 5%. The pan-European STOXX 600 slipped 0.6% and Spain’s IBEX 35 lost 2.0%.
Over in the US, indices were mixed as technology stocks outperformed while some large energy stocks declined. The Dow slipped 0.4% whereas the S&P 500 and the Nasdaq gained 0.2% and 1.0%, respectively.
The FTSE 100 was up 0.3% at the start of trading on Tuesday, ahead of the release of the latest UK mortgage approvals and consumer credit data. The figures for May showed a record rise in mortgage approvals following the recent extension to the stamp duty holiday, and the first lending increase since August 2020.
Infrastructure bill passes first hurdle
Last week, US President Joe Biden and a group of Democratic and Republican senators agreed a $1trn bipartisan deal to upgrade the country’s infrastructure. The eight-year plan includes funding for roads, bridges, railways and public transport, as well as expanding access to broadband and upgrading the power grid.
The plan would be funded by $125bn in unused Covid-19 relief funds, returned state jobless benefits, and greater tax enforcement.
The deal is a significantly pared down version of Biden’s original proposal, however the Democrats hope to push through a separate spending bill worth around $6trn. This would tackle issues such as climate change, education and childcare benefits and potentially be funded by tax increases on corporations and the wealthy.
The announcement helped to boost industrial, energy and financial stocks and outweigh concerns about the most recent US inflation reading.
US core inflation hits 29-year high
The US core personal consumption expenditures price index, an important inflation gauge, rose by 3.4% in May from a year ago – the biggest increase since 1992. On a monthly basis, the index rose by 0.5%, which was slightly below expectations of a 0.6% increase. The Bureau of Economic Analysis said headline inflation, which includes volatile food and energy prices, rose by 3.9% from a year ago – the biggest increase since August 2008, just before the worst of the financial crisis hit.
The increase partly reflected base effects from a year ago, when prices were supressed by the pandemic, as well as supply chain disruptions and growing demand as the economy reopens.
Separate figures showed US house prices are also continuing to soar. The median existing home price rose by 23.6% in May from a year ago, with every region registering price increases, according to the National Association of Realtors. This was a record high and marked 111 consecutive months of year-over-year gains.
BoE views high inflation as temporary
Here in the UK, the Bank of England sought to calm fears about rising prices by stating that while inflation could exceed 3% in the coming months, the surge was temporary.
“The committee’s central expectation is that the economy will experience a temporary period of strong GDP growth and above-target CPI inflation, after which growth and inflation will fall back,” the Bank’s Monetary Policy Committee said.
The Bank said stronger demand, rising commodity prices, supply side constraints and transport bottlenecks were all factors that had driven increased inflationary pressures.
This was reflected in the latest input price component of the manufacturing PMI, published last Wednesday, which hit an all-time high.
Chris Williamson, chief business economist at IHS Markit, said record levels in the survey’s price gauges and further capacity constraints “hint strongly that consumer price inflation has much further to rise after already breaching the Bank of England’s 2% target in May”.
Weekly updates like this from Brewin Dolphin help us keep up to date with what is happening in the markets.
Please continue to check back for our latest blog posts and market updates.
Please see below for Legal & General’s latest ‘Asset Allocation Team’s Key Beliefs’ article, received by us late yesterday 28/06/2021:
There are still a few weeks until Q2 earnings season, but early indications point to mainly positive news when events kick off properly in July. In this week’s Key Beliefs, we also discuss the ‘meme’ stock phenomenon and whether the 1960s pose a historical parallel for inflation today.
We’re in the middle of pre-announcement season for corporate results. While this is always very anecdotal in nature, company comments have so far had a generally positive tone and, perhaps even more tellingly, there has been an absence of any high-profile negative pre-announcements. Results from early reporters, companies with different quarter ends, have had a similar positive tone.
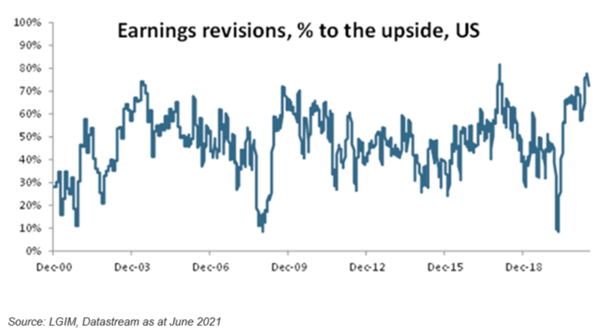
Another positive indicator is that earnings revision ratios have stayed at exceptionally high levels. There are always fewer forecast changes by analysts in between earnings seasons, but from the data that have come in, there have been far more upward than downward revisions. In May and the first few weeks of June, more than three quarters of revisions in the US were to the upside, a figure only matched in the immediate aftermath of recessions and after the corporate tax cut at the end of 2017.
All of this bodes well for the upcoming earnings season and adds confidence to the view that we’ll see another round of significant upgrades to analyst forecasts in the summer. And of course, significant analyst upgrades either put upward pressure on share prices or downward pressure on valuation multiples. We believe the truth will likely lie somewhere in between and continue the pattern of equities grinding higher at a slower pace than earnings estimates, which gradually deflates the high PE (price to earnings) ratios of the immediate recession aftermath.
Retail is here to stay
Retail investors and ‘meme’ stocks have been centre stage again in equity markets in recent weeks. Three things come to mind on the topic from a macro perspective.
First, the extreme moves continue to be limited to a handful of stocks. There are still no obvious signs of the volatility in affected stocks spilling over into the wider market. If you look closely enough, you can see the gyrations of Gamestop* and AMC* reflected in the relative intraday performance of US small cap indices like the Russell 2000. But the S&P 500 put together a long string of daily moves smaller than 1% in the last period of meme stock volatility.
Second, this most recent rally in retail favourites has been far weaker than what we saw in spring. This applies both to the magnitude of the outperformance of the stocks involved and to retail trading volumes. The share of TRF volumes (seen as a proxy for retail activity) of overall US volumes has stayed in the low-mid 40% range, which is far above pre-2020 levels, but a good bit below the nearly 50% mark regularly reached earlier this year. Overall, it’s still fair to say that the froth that was apparent in several retail-driven niches of the market in spring is much less of a concern today. Indeed, SPAC (‘special purpose acquisition company’) activity and prices have dropped a lot, as have prices in the digital asset sphere, like bitcoin.
Finally, if retail is a growing part of equity flows, then we are still in the early part of this story. The activity has so far been concentrated in Robinhood-type investors, who tend to be younger and less wealthy than the traditional retail investor base. US households own just under a third of US equities, but the top 10% of households own almost all of that, according to Goldman Sachs. Private client flow data from brokers show net purchases of equities this year, but their magnitude still pales into insignificance when compared with the previous decade’s net selling. So far, the increase in retail activity appears to have been driven by the smallest section of retail investors. The private client flow data suggest activity is spreading to traditional retail investors, but from today’s perspective we believe this theme remains much more of an upside than a downside risk.
Sounds of the ‘60s
In the mid-1960s, after years of subdued core inflation, there was a sudden increase which began a period of prices ratcheting higher. Unemployment fell through the first part of the decade, but as soon as it reached 4%, both wages and inflation moved up significantly. This suggested the economy was overheating and unemployment had probably breached the NAIRU a couple of years earlier. Indeed, it took a recession in 1970 to halt wage and price pressures temporarily, before the oil-shock induced big inflation of the 1970s.
The simultaneous increase in wages and inflation is a finding consistent with Ram’s econometric work, which shows that neither wages nor prices tend to lead one another; the wage and inflation process seems to happen simultaneously. So, if we wait for wages to move materially higher, we could be too late in spotting the inflation outbreak.
But there were some unique features of the ‘60s:
The Vietnam war played a crucial role. US Federal spending (entirely on defence) shot up by over 1% of GDP from mid-1965 to early 1967. The deployment of over 300,000 more troops served to tighten the domestic labour market further. This episode shows it is not a good idea to add stimulus to an economy already at full employment. The stimulus today has been in response to a large amount of slack, with unemployment still relatively high and participation low. We expect the current labour market demand and supply imbalances to be resolved later this year, but there are some risks if Congress passes a large deficit-funded infrastructure package
Unionisation exacerbated the wage-price spiral. The labour market appears much more flexible today, aided by an increasing number of ‘digital nomads’ or ‘work anywhere’ jobs
In the ‘60s, the Fed had far less sophisticated understanding of the role of inflation expectations (there was no TIPS market) and was less independent. We are confident that the central bank will take appropriate action, should the current wave of inflation not prove transitory
The increase in prices was broad-based. This is a clear difference from today, where the median CPI is still behaving well
In 1966, England last won a major football tournament (though I’m still convinced that the ball never crossed the line on England’s winning goal). This time round, however, we’ll need to wait a few more days to know whether it’s a unique feature of the 1960s or not…
Please continue to utilise these blogs and expert insights to keep your own holistic view of the market up to date.
Please see below article received from AJ Bell yesterday, which discusses the long-term picture after the latest US Federal Reserve meeting delivered a shock.
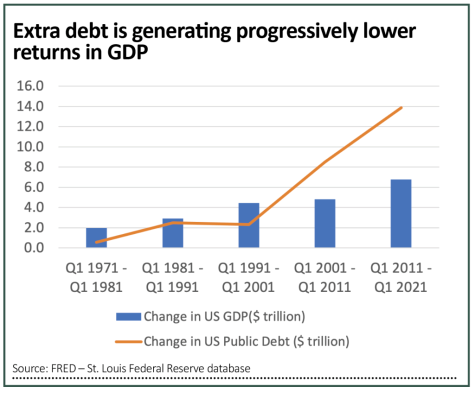
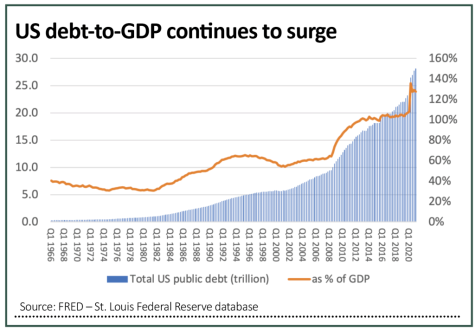
During the first 200 years of its existence, the US accumulated a cumulative federal debt of $1 trillion, the equivalent of 30% of its GDP (gross domestic product). In the last 40 years, that figure has surged to $28 trillion.
The good news is that the US economy has grown too, as annual GDP has advanced from around $3 trillion to $23 trillion. As a result, America’s national debt-to-GDP ratio has therefore grown from roughly 30% to 128% and that is bad news for two reasons.
First, it means that it is taking ever-increasing amounts of debt to generate an extra dollar of GDP.
Second, it leaves the US sitting well above the 80% to 90% debt-to-GDP ratio described by economists Kenneth Rogoff and Carmen Reinhart as a key tipping point, whereby economic growth would slow thanks to (unproductive) debt servicing costs – although that research, used by many governments as the basis for austere fiscal policies in the last decade, has since been widely challenged.
Whether you side with Reinhart and Rogoff or their detractors, the challenge that faces the US Federal Reserve is undeniable.
The US central bank needs to keep interest rates as low as it can to help the US government fund its interest payments even as it maintains welfare programmes, spends on defence, education and other vital needs, such as investment in public infrastructure.
That may leave the Fed having to raise interest rates to fend off inflation, maintain the value of the dollar relative to other currencies and maintain its credibility with financial markets and also holders of US treasuries, since they are effectively bankrolling America’s economy.
Investors now have to assess which way they think the Fed (and the White House) will go and to what degree the central bank’s ultimate policy path is priced into bonds, equities, commodities and currencies.
In the end, every option available to the chair Jay Powell and president Biden may help in some areas but do damage in others, as if to confirm the view of Stanford University professor Thomas Sowell that: ‘There are no solutions, only trade-offs.’
Multiple options
To make a reasoned decision here – and then draw up an appropriate asset allocation – investors will need to think like the Fed and its officials. History is very clear that there are only four ways out once a national debt reaches America’s current levels, relative to GDP:
Rapid economic growth. This is the best option, but it is not proving easy, if the period from 2009 and the end of the financial crisis is any guide. This underpins the push toward Modern Monetary Theory and the argument that governments should spend on productive assets and focus on the long-term payback rather than worry about near-term borrowing.
Default. This is not ideal, as serial offenders like Argentina will attest. It leaves you locked out of international debt markets and means you must pay higher coupons even if you can persuade someone to lend to you. It can also prompt capital flight, hitting both your currency and value of other assets and financial markets. The US will not countenance anything that jeopardises the dollar’s status as the world’s reserve currency (although most other developed countries face the same dilemmas and policy options).
Inflate. This is more like it and is exactly what the US and UK did when debt ballooned thanks to the Second World War. Rebuilding programmes and public spending fuelled growth, interest rates were kept below inflation and lenders were repaid in effectively devalued currency as a result. Yet again, though, this leaves the Fed with the dilemma of stoking some inflation but not too much that investors take fright and both financial markets and the wider economy are destabilised, as happened in the 1970s.
War. This is the option that no-one in their right minds would consider, even if the new Cold War between China and America feels like it is getting steelier by the month, even if president Biden is now in the White House rather than Donald Trump. Taiwan is still a potential flashpoint for ‘Hot War’, both territorially and technologically, thanks to Taipei’s predominance in the global silicon chip supply chain.
Path of least resistance
If growth is unlikely (or least relies on wanton government borrowing and overspending) then inflation still appears the likeliest outcome, but the Fed will not want to tighten policy too far, too fast. Just look at how financial markets are welcoming talk of two Fed rate hikes to the far-from-challenging level of 0.75% by the end of 2023. Equity and commodity price wobbled and volatility indices such as VIX moved higher.
Yet the US 10-year treasury yield fell, the last thing you would expect if inflation is coming, especially when yields are already miles below the current rate of increases in the cost of living.
These trends may not be as mutually exclusive as investors might think. The Fed is still running QE (quantitative easing) flat out to massage yields lower. There is more uncertainty now over its policy direction than there has been for some time. Investors seek havens, like bonds, at times of concern.
Perhaps the bond and stock markets are getting ready for the return of volatility and bumpier times ahead. But then the chances of the Fed raising rates or hauling in QE may recede further, as the end of the debt-fuelled bull market and economic upturn would surely be seen as deflationary and any policy response would have inflation as its ultimate goal.
We will continue to publish relevant content, market updates and news as we optimistically push towards the end of lockdown restrictions in the UK.
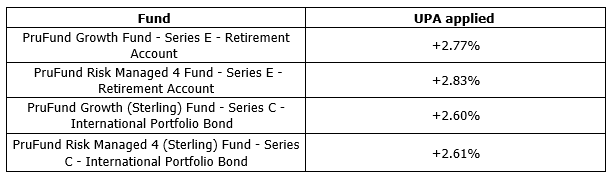
I’ve just cut and pasted this content from an email received this afternoon (25/06/2021) from Prudential about upwards Unit Price Adjustments: PruFund Series E and Series C funds UPA announcement
At this month’s review, we’ve announced upward Unit Price Adjustments (UPAs) to the Series E (Retirement Account) and Series C (International Portfolio Bond) PruFund range of funds.
On the monthly PruFund Investment Date, a UPA is applied if the unsmoothed price is:
4%, or more, higher than the smoothed price, for our PruFund Cautious, PruFund Risk Managed 1 or PruFund Risk Managed 2 funds, or
5%, or more, higher than the smoothed price for our PruFund Growth, PruFund Risk Managed 3, PruFund Risk Managed 4 or PruFund Risk Managed 5 funds.
Growth rates aren’t guaranteed. The value of an investment can go down as well as up. Your client may get back less than they have paid in.
This is good news from Prudential as markets and economies recover. It’s still pretty volatile with both headwinds and tailwinds for investments.
Your best option is to remain fully invested and focus on your long-term goals.
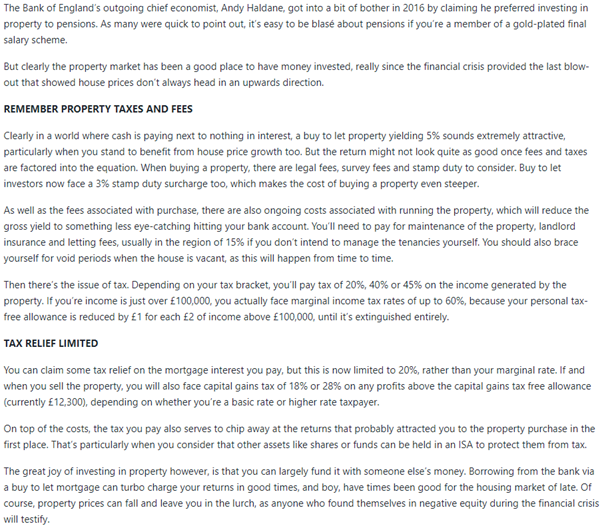
Please see below an article published yesterday (24/06/2021) by A.J. Bell, which outlines factors that need to be considered when thinking about using Property as a vehicle for retirement:
Please continue to check our Blog content for advice and planning issues and the latest investment, markets and economic updates from leading investment houses.
Please see article below from Invesco received yesterday afternoon – 23/06/2021
Is the best yet to come for US Stocks?
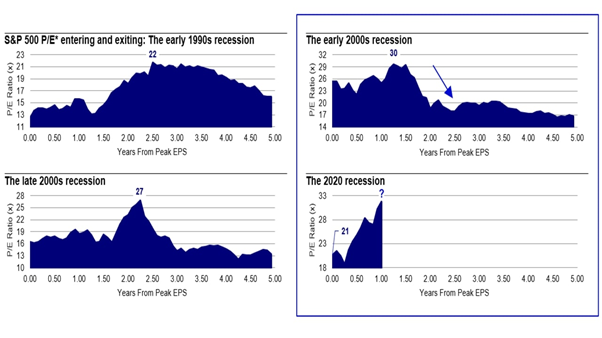
In the first year of this new market cycle, stocks enjoyed strong returns alongside expanding price-to-earnings (P/E) multiples and deteriorating business fundamentals. Naturally, investors wondered how stocks could do so well when earnings were so bad?
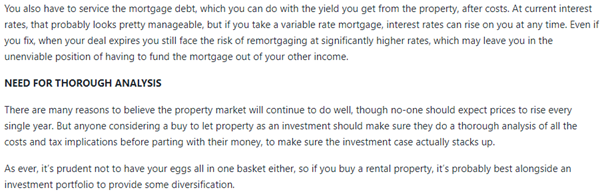
However, the combination of expanding P/E ratios and contracting earnings is far from unusual. Like clockwork, corporate profits fell and multiples rose during each of the last four recessions, including this one (Figure 1).
Figure 1. Like clockwork, earnings fell and multiples rose during each of the last 3 recessions, and this one was no exception
Sources: Bloomberg L.P., Standard & Poor’s, Invesco, March 31, 2021. Notes: Operating EPS = Income from products (goods and services), excluding corporate (M&A, financing, layoffs) and unusual items. EPS = Earnings per share. P/E = Price-to-earnings ratio or multiple of EPS. Economic recessions are defined by the National Bureau of Economic Research (NBER). An investment cannot be made in an index. Past performance does not guarantee future results.
Why? One explanation is it’s a denominator effect. When earnings (E) decrease, they cause the P/E ratio to increase. Another explanation is that stocks, which are leading indicators of business activity, anticipate corporate profits by three to six months. Near major lows in the business cycle, stock prices (P) tend to look across the valley to better times ahead, as they’ve done over the past year.
Aren’t stocks overvalued?
In the second year of this new market cycle, investors are now concerned about lofty stock market valuations with seemingly little room for further gains.
Nonetheless, history informs us that stocks grew into their multiples after every recession since the early 1990s. In each case, it was just a matter of how soon that process began. In the early 2000s, P/Es peaked a little more than a year after earnings peaked.
Currently, we think the stock market is nearing the end of its transition from peak earnings to peak multiples (Figure 2).
Figure 2. Stocks may be on the verge of growing into their multiple, which they did after each recession since the early 1990s
Sources: Bloomberg L.P., Standard & Poor’s, Invesco, 03/31/21. Notes: *Trailing 12-month operating. An investment cannot be made in an index. Past performance does not guarantee future results.
What’s better for stocks? Multiple expansion or earnings growth?
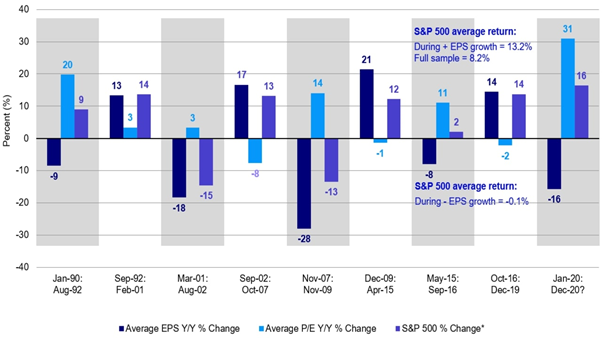
More importantly, my research shows that stocks produced consistent double-digit returns during periods of positive earnings growth over the past 31 years, regardless of what multiples did.
While the stock market did very well last year, the combination of rising P/Es and falling profits hasn’t always been good for stocks. Since 1990, negative earnings growth and expanding multiples actually produced below-average (i.e., flat) stock market returns.
True, multiple expansion helped generate positive single-digit returns in the early 1990s and 2015-2016. But that wasn’t the case in the early or late 2000s, when returns were deeply negative (Figure 3).
Figure 3. Multiple expansion helps, but stocks did best during periods of positive earnings growth, regardless of what multiples did
Sources: Bloomberg L.P., Standard & Poor’s, Invesco, 03/31/21. Notes: *S&P 500 % change = Compound annual growth rate (CAGR). An investment cannot be made in an index. Past performance does not guarantee future results.
After a year of deteriorating business fundamentals, what’s the outlook for earnings?
The good news is that unsmoothed earnings growth is already showing nascent signs of bottoming, much like it did in the relatively short and shallow economic recession of 2001. At first blush, terrorism and pandemics have little in common. Another look reveals that both the 2001 and 2020 economies were struck by endogenous shocks, leading to fear and shutdowns, which gave way to rapid recoveries in confidence, mobility and business conditions. Looking ahead, my framework of leading indicators signals that a V-shaped recovery in earnings growth greater than 20% may be imminent!
As Frank Sinatra once sang, “Out of the tree of life I just picked me a plum. You came along and everything’s startin’ to hum. Still, it’s a real good bet, the best is yet to come.”
Please continue to check back for our regular blog posts and updates.
Investors are focusing too much on certain sustainability areas, without paying attention to the broader – or even counterproductive – effects. Invesco partnered with The Economist to explore the topic in more depth in their ‘The art of the possible’ series.
Sustainability is the new investment ‘must-have’. It’s estimated that about 20% of investments are badged environmental, social and governance (ESG) of one form or another, and that proportion grows continually. That’s a lot of money: about $20trn and counting.
This has generated a ‘green rush’—what’s now the largest trend in investment. But it isn’t a silver bullet to make money and do good. Although the positive aspects are very real, there are also challenges: how the benefits and costs of such investments are apportioned—indeed, even down to how they are calculated.
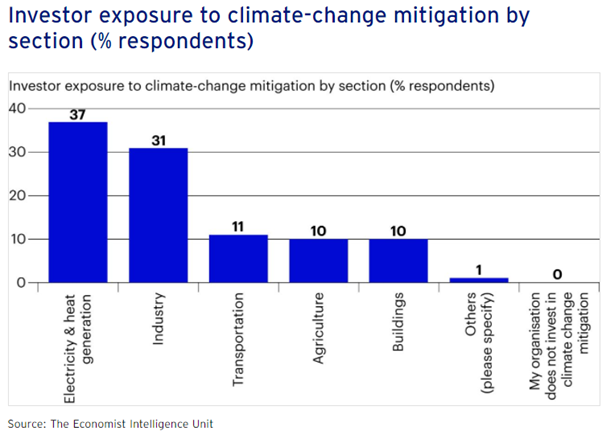
There is, for instance, a persistent disparity between where environmental investments are going—largely towards established technologies such as wind and solar—and integral parts of the sustainability puzzle that remain underinvested. A recent survey of large investors globally conducted by The Economist Intelligence Unit found that electricity and heat generation, followed by industry-related investments, represent the lion’s share of sustainable investments. Jason Tu, cofounder and CEO of ESG analytics company MioTech, is seeing a lot of investor interest in “energy generation, transmission or storage, or usage such as electric vehicles”. He also cites farming technology as a particularly hot topic among investors.
Conversely, buildings, transport and agriculture, despite being major sources of greenhouse gases (GHG), have relatively low uptake.
How useful is ESG?
“The starting point for ESG is flawed,” argues Aswath Damodaran, professor of finance at New York University’s Stern School of Business. “We’re trying to substitute company behaviour for laws we should be passing as a society.”
However, others object that pushing this back onto society or the individual is a distraction from the role large corporations play—and sometimes an intentional distraction at that.
“Professor Damodaran is quite wrong to think that anyone in ESG actually thinks voluntary action is a good substitute for good laws,” says Mark Campanale, founder and executive chairman of the Carbon Tracker Initiative. “Quite the opposite. What ESG does however recognise is that the law is a minimum and we should all aspire to higher standards. When governments abrogate their responsibilities—for example by allowing themselves to be lobbied by powerful business interests to block certain standards—then shareholders can step in and take action.” He points to the recent removal of senior executives at Rio Tinto over the mining violation of indigenous Australians’ historical sites as a good example of this.
Technology is playing an increasing role in exposing these sorts of abuses. Mr Tu cites the use of satellite imagery “to see whether there’s any decrease in greeneries at the plantation, or any kind of signs of pollutants around a 30 km radius of a factory”.
This helps investors ensure that their sustainable projects are actually doing good—and choosing projects where they care about their success is exactly how Professor Damodaran suggests approaching green investing. “My advice to investors is pick your dimension of goodness,” he says. “Each of us has something we think is most critical to us, and invest based on that dimension, which means ESG scores are completely useless.”
How well does a company perform on gender diversity, water usage, emissions and so on? Distilling all these factors and more to one ESG number is obviously problematic. Some investors want as low fossil fuel exposure as possible—while others will intentionally be targeting more carbon-intensive companies—to finance a transition from the brown to green economy. ESG scores cannot resolve this; it’s only the starting point.
Mr Campanale takes a different approach: “ESG scoring is neither an investment thesis nor a strategy. What’s more compelling is to find areas that can demonstrate a valuable impact on society, for example investing in the clean energy revolution, or medical technologies. ESG-led investment research strategies that allow you to invest in a spread of high social impact enterprises is really at the heart of responsible finance.”
Pedal to the metal
Such strategies can’t be summed up in one number. A single ESG score—one number encompassing diverse factors—arguably doesn’t tell you much. A fund or stock can have a high ESG score by being in an industry with a low carbon footprint, such as finance, for example, or simply by reporting on lots of metrics that ESG ratings agencies score on. Some large oil companies, for example, score well on transparency, compensating low E with high G.
A positive impact in one area, earning a good ESG score, can also have a negative impact in other areas, which may not be highlighted by some ESG metrics, and so asset owners may be unaware of important consequences of some of their investments. One example of this is the knock-on effect of low-carbon technologies on metal extraction. These technologies use much larger amounts of metal than fossil fuel-based systems, creating an exponentially rising demand. An electric car typically contains 80 kg of copper, four times as much as a petrol-fuelled one. Both wind and solar power plants contain more copper than their fossil fuel equivalents: a typical solar plant contains about 5 kg of copper per kilowatt versus 2 kg per kilowatt for a coal-fired power station, points out economist Frances Coppola.
“It’s surface level ESG, because you think about carbon footprint, you think people who produce gas cars create this huge carbon footprint,” says Professor Damodaran. “If you create electric cars, you’re good. But electric cars create their own costs. And if you start digging into those costs, the question you have to ask is, are we really trading one devil for another?”
Given the reliance of the green energy transition on poorly regulated mining in these regions, does this not risk minimising the S in ESG? And is this not creating wilful blind spots to other forms of environmental degradation? It leads to the accusation, expressed pointedly by charity War on Want, that this green rush threatens a “new form of green colonialism that will continue to sacrifice the people of the global south to maintain our broken economic model”.
That the developed world has used the available resources, then pulled up the ladder to the global south, is echoed by Invesco’s The 21st Century Portfolio report, authored by Paul Jackson, which notes “the developed world has got rich by using up the CO2-absorbing capacity of the atmosphere, leaving little room for the rest of the world to develop”.
For Professor Damodaran, addressing the issue cannot rest at the door of the corporation: “Much of the ESG literature starts with an almost perfunctory dismissal of [founder of monetarism] Milton Friedman’s thesis that companies should focus on delivering profits and value to their shareholders, rather than play the role of social policymakers,” he says.
This article highlights one of our key points about ESG which we have repeatedly stated over the past year throughout our ESG related content, that ESG is a journey.
It isn’t a ‘one size fits all solution’, its about aspiring to do better.
As the ESG trend continues to grow, fund managers and investors alike, are learning more and more every day. Companies are having to adapt to the increasing ESG standards that are set.
Whilst a company may only score well on one aspect of ESG, it may be lacking in others, however over the next few years, ESG isn’t going away so it’s important to remember that every company will have a starting point and should continue on their journeys to improve in all aspects. If they don’t, they will be held accountable by their clients and fall behind the rest who will be actively trying to improve their ESG ratings.
Keep checking back for our usual market updates, insights and ESG related content.
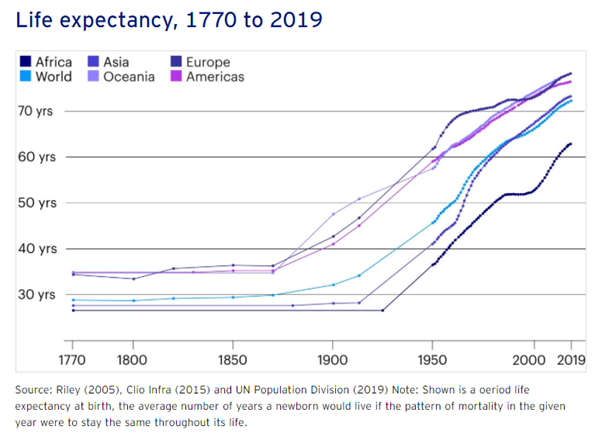
Please see below an article published by Invesco within the last week covering an interesting topic for us all.
As you can see from the above article, longevity is increasing. This increase in longevity, places additional importance on ensuring you draw a sustainable level of income from your assets in retirement to target maintaining a standard of living that you are accustomed to.
Current industry research suggests that drawing between 2% and 4% per annum of the value of the total invested assets as an appropriate withdrawal rate which should help investors sustain the value of their assets over the long-term.
Global events, such as Covid-19 which had a big impact on markets when it was announced, could accelerate depletion of assets. Receiving ongoing advice in retirement can help mitigate some of the risks and help you protect and sustain your assets.
Please continue to check our Blog content for advice and planning issues and the latest investment, markets and economic updates from leading investment houses.