Please see the below article from Royal London received over the weekend:
The majority of our assets just over 90% – are invested with Royal London Asset Management (RLAM), and their responsible investment team is doing great work to help drive the move to a low carbon economy and leading the way on the Just Transition. What is the Just Transition?
Just Transition ensures that social issues are taken into account in moving to a low carbon economy. Rapid climate action that limits global warming to below 1.5ºC prevents the worst human and economic costs of climate change. A Just Transition ensures this climate action also supports an inclusive economy and avoids exacerbating existing injustices or creating new ones.
We care about Just Transition in the industry, because without adequate considerations of the social impacts of accelerating the path to Net Zero, there is a risk that people will not be willing to make the hard choices we need in order to limit the impacts of climate change. This can lead to policy delays and uncertainty. Companies that acknowledge this challenge and plan for a Just Transition, will be more likely to deliver on their commitment to low-carbon growth. We believe energy utility companies should develop formal Just Transition strategies to manage social risk and ensure they continue to deliver good value for society and their investors.
A just transition for Scottish and Southern Energy (SSE)
SSE is an energy utility company that helps produce and distribute gas and electricity to our homes. It is one of the largest producers of wind power in the UK and has committed to become ‘net zero by 2050’ – which means that by 2050 the amount of greenhouse gas emissions produced by SSE will be equal to the amount it removes from the atmosphere.
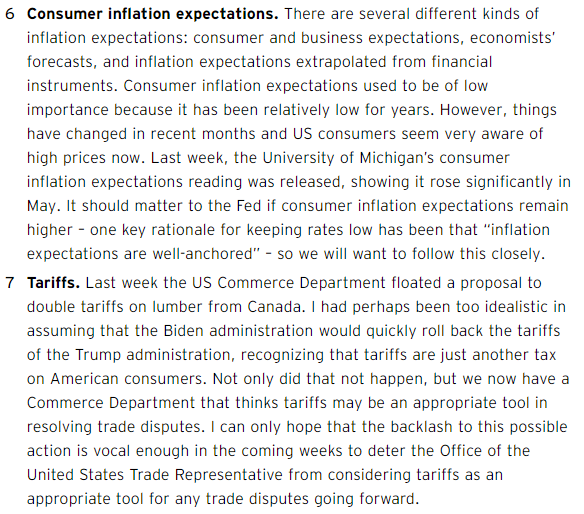
RLAM’s responsible investment team has been champions of SSE’s strategy to move to wind power and reduce its reliance on coal and gas, which will have a big benefit for our climate. However, they’ve also been talking to SSE about the Just Transition – what the company is doing to ensure that its transition to lower carbon energy also considers any negative social consequences like significant job losses or making energy bills unaffordable. Solving the climate crisis is not straightforward, and the responsible investment team is asking companies to take a more holistic view and look at both the social and environmental consequences of taking action.
Please continue to check back for a range of blog content, from ESG focused pieces like this one to market updates and insights from a variety of the worlds’ leading investment houses.
Please see the below article from Tribe Impact Capital received yesterday afternoon:
Driven by changing consumer behaviours, increasing choice and affordability, recent net-zero pledges by governments and the desire to ‘Build Back Better’ after the pandemic, the demand for electric vehicles (EVs) continues to grow. According to Bloomberg New Energy Finance, EV sales will rise to nearly 60% of the global auto market by 2040, a huge shift from almost 0% in 2010. With consumer consciousness on the rise and market forces gaining momentum, EVs are quickly becoming the future of the automotive industry and a target market for investors.
However, before any serious adoption of EVs can take place there needs to be significant investment in the infrastructure that supports EVs. This includes the charging points but also the entire electricity grid.
EV charging points
The issue of sufficient access to electric charging points for those who don’t have the access to off-street parking needs to be addressed if there is to be widespread adoption of EVs. A report by the European Automobiles Manufacturers association in October 2020 showed that while EV sales in Europe had increased over 100% during the last 3 years, the number of public charging points had grown by just 58%. Similarly, in the UK, all-electric cars went from 1.6% of the market in 2019 to 6.6% in 2020. The report found the UK is likely to need around 400,000 public charge points by 2030, a considerable increase from the existing 35,000. The current installation rate of 7000 a year is not enough to meet requirements if the UK is to be ready for the ban on sales of cars with an internal combustion engine in 2035. Installation will need to occur five times faster at a cost of between £5 billion and £10 billion by 2030.
Providing enough residential on-street charge points and charging facilities in public spaces will be critical in high-density residential areas where it’s simply not feasible for every property to have cables running from their electricity supply to their vehicle. National Grid points out that with 20 million EVs on the road there will be at least 8.6 million vehicles that will not have the facilities for charging at home.
This is not just an issue for the UK though. The quantity of public chargers is growing the fastest in China, followed by Europe and then the US. China still has the largest network of public chargers. They had more than 500,000 chargers by 2019, accounting for more than 50% of the global total. However, a large number of chargers does not mean an ideal vehicle-to-charger ratio. While China’s passenger electric vehicle-to-public charger ratio (8.5 to 1) is lower than that of the United States (17 to 1), some European countries have even lower EV to public charger ratios (France: 7 to 1; Germany: 5 to 1; and the Netherlands: 4 to 1).
Electricity demand
The second major infrastructure to consider is the supply and distribution of the electricity itself. At their current trajectory EVs are set to double domestic electricity demand. At scale, this would present significant challenges to the distribution network. As we see increased adoption of intermittent renewable energy sources we might start seeing large imbalances between supply and demand in terms of power provision. Not only do we need to build out our existing network capacity and reinforcement we need to get better at managing system stability, energy storage and smart charging.
What does this mean for investors?
The UK government recognises that widespread adoption of EVs is key to achieving their climate goals with the Chancellor announcing in the government’s spring Budget that £500 million will be invested into a rollout for charging hubs. Whilst this investment will help play a role in piecing together the UK’s fragmented infrastructure and easing the pressure on public sector organisations, more capital for wider and faster deployment of a national charging grid is needed. Many supermarkets are now providing electric charging hubs in their car parks in partnership with others. Many supermarkets in the UK have increased their commitments to sustainability and investors are now starting to look at these companies with renewed interest.
Despite the noise and potential in companies like Tesla, Nio and others, for example, Volkswagen, the EV story also represents plenty of opportunities for investors outside the main car manufacturing segments. Charging points are the next logical step but looking at the sector more broadly there are opportunities in smart metering, battery storage, network improvement, smart cities and core technology (for example semiconductors, and artificial intelligence). The shift to EVs will have major implications not just for the way we travel, but the way we build cities and our consumption of electricity itself. With this in mind, the opportunities for investors further increase.
For example, smart meters (electronic devices that accurately monitor electricity use and send this information to the user or the utility company to effectively manage and optimise energy consumption) are key to driving efficiency in energy usage. They can potentially manage the demand on the grid by notifying consumers of the best time to charge, helping reduce consumer costs. Renewable electricity providers are also starting to provide ‘free’ tariffs for EV owners to manage potential cost implications.
The market for smart meters is growing rapidly and in 2019 US electric companies installed over 98 million smart electric meters, covering more than 70% of US households. The global smart meter market size was valued at $21.13 billion in 2019 and is projected to reach $39.20 billion by 2027, an annualised growth rate of 9%. Utility companies are keen to install meters, they enhance the energy grid’s resilience and operations and help provide visibility into the system operations, thereby avoiding outages.
Similarly, the battery storage market is set to double over the next 5 years. Batteries provide a critical role in our future power systems as they provide the flexibility required by the grid to support the variability of power generation from renewables when environmental conditions are not favourable for power generation. Not only is demand going up, but input costs are coming down. By 2030, total installed costs could fall between 50% and 60% (and battery cell costs by even more), driven by optimisation of manufacturing facilities, combined with better combinations and reduced use of materials. Battery lifetimes and performance will also keep improving, helping to reduce the cost of servicing. Improved batteries will help support the grid by providing flexibility to store energy and release it when demand for EV charging is high.
With all investment opportunities, however, comes risk. The widespread adoption of electric vehicles comes with some stings in the tail, most notably the use of rare earth and precious metals used in the battery and technology embedded in the vehicles themselves. Complex supply chains, sometimes in politically unstable geographies and/or where the rule of human rights may be less robust, increase the risk of human rights abuses, as well as environmental degradation. As investors it is essential to be aware of and manage these risks. Doing so can uncover solution opportunities, for example, in businesses dedicated to the recycling of these rare earth minerals at end of life in many rechargeable battery applications.
Global governments have built widespread adoption of EVs into their carbon neutral plans which will have major implications not just for the way we travel but the way we build cities and our consumption of electricity itself. For investors, it’s important to look at the bigger picture and recognise that the opportunity set is much wider than a few automobile names.
This is an interesting look at the investment opportunities within the electric vehicle landscape looking beyond just investing in the vehicles themselves or the big EV companies (i.e. Tesla), but looking at the infrastructure around this, charging points, smart metres, clean energy etc.
The pandemic not only changed the world itself, but how people think about the world, the environment and what the future will look like.
This is a growing investment space and another key indicator that ESG has gone mainstream.
Please see below an article which was published yesterday (02/06) by Kristina Hooper, Chief Global Market Strategist at Invesco, which outlines various areas to watch throughout June:
As you can see from the above, the are a lot of moving parts that need to be monitored. Some of the key areas to focus on are:
The unlocking of the Eurozone – hopefully retail sales flow through in line with the easement of restrictions.
Inflation expectations – Inflation remains a hot topic. We will see just how much pent-up inflation has built up and whether this is long-term trend which will force central banks to act or whether this is a result of an initial supply and demand chain issue resulting from economies opening up.
Covid vs Vaccine rollout – whilst the vaccine rollout in developed economies is ramped up, variants in developing countries could still pose a threat.
Geopolitical tensions – as things slowly start to return to a form of normality, geopolitical tensions are becoming mainstream news again.
There was also mention of a potential summer sell-off, this should not be ignored or overlooked, but it remains important to note:
This is Invesco’s view, other fund managers may have a different opinion on this
If a sell-off does happen, this may not necessarily be a bad thing as it can create buying opportunities
Investors need to consider their long-term objectives and investment time horizon. Markets will recover from any sell-off, it’s just a matter of time and investors need to be patient.
Please continue to check our Blog content for advice and planning issues and the latest investment, markets and economic updates from leading investment houses.
Please see below article received from Legal & General yesterday afternoon, which offers insightful analogies relating to inflation and current global market performance.
When two people jump on a trampoline simultaneously, their gravitational potential energy (what goes up must come down) is converted into elastic potential energy in the trampoline (what goes down must come up). If one of the participants (the bouncer) lifts up their legs at the point of maximum trampoline stretch, all the energy is transferred to the other participant (the bouncee). This launches the bouncee into the air much more emphatically than a single person could achieve by themselves. If the bouncer is a lot heavier than the bouncee, then the results can be spectacular. This phenomenon makes us think of inflation today.
Trampolines and inflation
In this analogy, the pandemic is the bouncer and prices are the bouncee. Historically, prices that fall hard have had little tendency to revert. As former Crystal Palace manager Iain Dowie might have put it, there normally isn’t much “bouncebackability”.
But prices have been emphatically “double bounced” in recent months: the pandemic exerted incredibly unusual downward pressures as demands for hotels, restaurants and airlines collapsed. That stretched the trampoline elastic to its limits. Suddenly removing the pressure has catapulted prices higher, with a slew of indicators pointing to near-term inflation taking off.
Having been double bounced, the question is whether inflation will stay high. It is tempting to believe high prices will stay high forever, but financial markets seem to be buying into the Crystal Palace prognosis. Dowie’s comments were triggered by the team bouncing back into the Premier League in the 2003-04 season from a seemingly dire position in mid-November. However, they were relegated again the following season.
Similarly, the US inflation curve is inverted: after a bout of higher inflation over the next few years, markets are priced for a return to something more normal thereafter. Sinkbackability is the flipside of bouncebackability.
The post-recession equity playbook
If you were worried about equity valuations before, are you a little less worried now? Since mid-April, the S&P 500’s forward price-to-earnings (P/E) ratio is down by over a point. At 21.3x we can’t exactly call it cheap, but it reflects an encouraging trend and one we expect to continue for some time. Put another way, the forward earnings yield has increased by around 0.2%.
In a benign de-rating, share prices are up, but by less than earnings; P/E ratios decline as a result. Since mid-April, the S&P 500 is up marginally, but the next 12 months’ forecast earnings are up by 7%.
We’re not just seeing this picture in the US, either. Estimates of forward earnings are upby 5.5% in Europe, and 8% for the DAX; even the less-cyclical FTSE 100 has seen forward earnings estimates rise by 3.5%.
This is a normal pattern after recessions, so not entirely unexpected. But it’s noteworthy that it has started, because until now it had been missing from this cycle.
In Phase 1 after a recession, prices typically go up a lot more than earnings, in anticipation of the earnings rebound. That would be the P/E expansion we had last year. In Phase 2, that picture reverses and earnings go up by more than prices, so P/E ratios contract. That’s what we’re seeing now.
The S&P 500 grinding higher with headline valuations drifting lower is the general pattern we expect to see over the next year. We are therefore relatively relaxed about high P/E ratios today, with a lot of earnings growth likely to be ahead. If we were to be at these same multiples this time next year, we would be a lot more worried.
A tinker, not a taper
Have US interest rates been rising or falling recently? It seems like a straightforward question with a straightforward answer. The first quarter was the fifth-worst quarter for US Treasuries in the past three decades, as 10-year yields rose by nearly 90 basis points. Every market commentator under the sun is now talking about a “rising interest rate environment” and what that means for other asset prices. But, did you know that US money-market rates have just fallen to all-time lows?
That seems a symptom of a superabundance of cash looking for a home in short-dated securities. The Federal Reserve is hosing the financial system with money and there simply isn’t enough short-dated government debt to go around.
Does any of this matter for assets outside the money-market space? We can think of two implications.
First, the dollar’s been weak at the same time as the short end of the yield curve has been collapsing since March this year. The Bank of England’s Jan Vlieghe has signalled a possible rate hike in the UK as early as May next year, we had a similar nod from New Zealand last week, and the rates payable on emerging currencies have started to drift higher. As long as the Federal Reserve refuses to even “think about thinking about” raising rates, it’s hard to see the dollar trend turn around.
Second, we’ve seen general collateral and triparty repo rates nailed to the floor in recent months, down from +10 basis points at the end of last year. That’s not a huge change, but it makes it that little bit cheaper to fund long-duration positions or more expensive to fund short-duration positions. We are tactically short duration, but the emphasis is on ‘tactically’, given the carry costs (which are getting steadily worse) and positioning.
To ‘fix’ the problem, we expect the Federal Reserve to push up its administered rates at the next opportunity in June. Precedent for tinkering with the Interest On Excess Reserves (IOER) can be found in both June 2018 and January 2020. The trick this time will be to persuade the markets that this adjustment is not a tightening of monetary policy. A tinker, not a taper, will be the order of the day.
We will continue to publish relevant content as we edge towards ‘Freedom Day’ on the 21st of June.
Please see the below article received from JP Morgan this morning:
‘In our view regulatory interventions will increase, and these interventions will underpin carbon prices not only in Europe, but also globally.’ – Vincent Juvyns
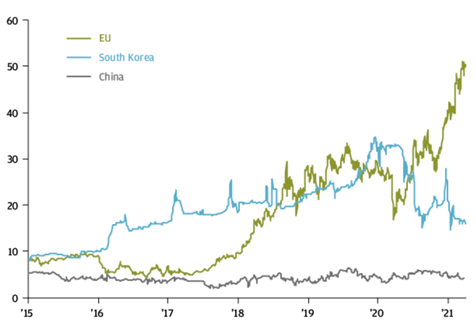
European policymakers have been focused on tackling climate change for many years. The launch of the European Union’s (EU’s) Emission Trading System (ETS) in 2005, the first carbon market in the world, has been the cornerstone of the bloc’s policy efforts. Since then, the ETS has been upgraded several times to reflect the EU’s growing climate ambitions and changes are now accelerating further since the EU has agreed to reduce its greenhouse gas (GHG) emissions by at least 55% by 2030. These regulatory initiatives at least partly explain why prices for CO2 emissions allowances in Europe have recently reached an all-time high of 56 euros per tonne of carbon dioxide equivalent (tCO2e).
The EU’s example is being increasingly copied, with several individual countries launching their own emission trading systems. At present, global carbon prices remain well below those seen in Europe. If they fail to move in line with what the EU deem to be acceptable, the subject of carbon taxes at the EU border will be an increasing reality. This is why we believe investors should be aware of the impact of higher carbon prices on their portfolio.
What drives carbon prices? Europe case study
There are two main types of carbon pricing mechanisms: a carbon tax, which is the most direct way to set a price on carbon, but which doesn’t set a pre-defined emission reduction target; and an emissions trading system, which caps the total level of GHG emissions, but doesn’t set a pre-defined price.
The EU chose the second approach when it created its ETS in 2005. The EU’s ETS is the world’s first and also the largest emissions trading system as it covers 45% of the EU’s GHG emissions produced by three sectors within the European Economic Area: electricity/heat generation, energy-intensive industry, and commercial aviation.
Companies in these sectors are allocated a free emissions allowance. Those with lower emissions than their allowance can sell their “unrequired” emissions to other companies in the sector (Exhibit 1). The balance between supply and demand for emissions creates a market price.
The EU can influence supply and demand dynamics to raise the carbon price in three ways: by reducing the emissions cap; by increasing the industries subject to the scheme; and/or by reducing the allocation that is deemed free.
In its recent directive, the EU decided that the aggregate emissions cap will fall by 2.2% per year from 2021 onwards (vs. 1.74% before). The EU is still deciding whether to include new sectors, such as transportation and buildings. The percentage of free emissions allowances, which had already fallen from 80% in 2005 to 43% in 2020, is to gradually decrease to 30%.
As a result, while some of the recent surge in the carbon price may reflect strong demand for emissions allowances as firms meet rising demand, there is a structural underpinning to higher carbon prices from regulatory interventions.
The balancing act between internal drive and external competition
EU authorities are mindful of the delicate balancing act they face between meeting domestic climate ambitions while at the same time not damaging corporate profitability and competitiveness compared to international competitors that are not subject to similar regulatory standards. Encouraging international peers to keep up with the EU’s efforts is bearing some fruit: other regions are beginning to launch their own emissions trading schemes and 25% of global GHG emissions are now covered by carbon pricing initiatives compared to just 5% in 2005 (Exhibit 2). However, the carbon price in these regions is much lower than in Europe (Exhibit 3).
Coverage of global emissions trading schemes and the impact on carbon prices
Exhibit 2: Global emissions covered by carbon pricing initiatives
% of global greenhouse gas emissions
Exhibit 3: Emissions trading system prices
USD per tonnes of CO2 equivalent
Carbon prices internationally are not only lower than those in the EU, they are also below those required to meet the global climate objective of reaching net zero emissions by 2050 according to many climate scientists and policymakers. Although the estimate is wide, a range of between USD 40 and USD 80 per tCO2e is often argued as necessary to limit global warming to less than 2°C.
Carbon prices will no doubt be a key topic of conversation when global leaders convene at COP26 in November. If the EU, China and the US cannot agree on a path towards a common carbon price, the EU may need to find a short-term solution to ensure that its climate efforts do not disadvantage European businesses.
One solution that appears to be growing in appeal is a carbon border adjustment mechanism (CBAM). This import tariff would be designed to ensure that the environmental footprint of a product is priced the same whether it is manufactured locally or imported. The CBAM is one of the key measures discussed as part of the EU’s Green Deal. The proceeds of the tax would form part of the EU’s budget, which would be used to finance the EU’s recovery and green transition.
At this stage the CBAM is a threat to international peers, but the credibility of that threat has been strengthened given the legislation that would be required has been approved by the European Parliament. It is now up to the European Commission to decide whether to use it.
Investment implications
In our view regulatory interventions will increase, and these interventions will underpin carbon prices not only in Europe, but also globally. The result will be an increase in the cost base of companies in a growing number of sectors.
One of the key investment implications is that increased business costs may serve to raise consumer prices, adding to growing inflationary pressures from loose monetary and fiscal policies. If firms are unable to pass on higher costs the higher carbon prices may dent profitability.
If the CBAM is activated, companies that export a lot of their carbon-intensive products to the EU may suffer from higher carbon prices, even if their home country does fairly little in terms of carbon regulation. The price of carbon is therefore a risk that needs to be monitored.
On top of traditional financial analysis, investors may look to evaluate non-financial parameters, such as the carbon intensity of companies, as we believe that minimising the carbon intensity of a portfolio should help improve its risk/return profile over the long term. This is what we have already observed over the last couple of years when comparing the MSCI World index with the MSCI World Climate Change CTB Select, a Climate Transition Benchmark under the EU Benchmark Regulation, which reweights securities based upon the opportunities and risks associated with climate transition risks.
Indeed, the MSCI World Climate Change CTB Select Index has a Weighted Average Carbon Intensity (which represents the number of metric tonnes CO2 equivalent emissions per USD million enterprise value including cash) that is almost 40% lower than the MSCI World Index, while it has also outperformed the latter by 150 basis points since its inception in November 2013, and has a better Sharpe ratio over the last three and five years.
With global carbon prices set to increase further in the future, minimising the GHG emissions of a portfolio should not only contribute to the fight against global warming, but it should also lead to better risk-adjusted returns in the long run.
Please continue to check back for a range of blog content, from ESG focused pieces like this one to market updates and insights from a variety of the worlds’ leading investment houses.
Please see article below from AJ Bell – received yesterday afternoon 27/05/2021
Potential shift by US central bank could be bad for stocks
The Federal Reserve is walking an increasingly wobbly tightrope between maintaining economic recovery and appeasing investors’ inflation worries
Investors should watch the US Federal Reserve very closely as the central bank is showing signs of a shift in thinking. This could have major implications for the direction of stocks.
The US economy grew at an annual rate of 6.4% in the first quarter of 2021, the second fastest since 2003 while initial jobless claims dropped to a post-pandemic low in the period.
Even so, the US Federal Reserve, which sets monetary policy, has vowed to keep interest rates close to zero until it sees clear evidence of sustained growth and the jobs lost during the pandemic regained.
The Fed interprets increasing inflation as a temporary phenomenon caused by the base effect from last year’s lockdowns and supply chain disruptions. That was the consensus view until the 19 May release of minutes from April’s policy making committee meeting.
It now seems a greater number of committee members are beginning to think about slowing the pace of asset purchases which have been running at $120 billion a month since June 2020.
The asset purchase programme is designed to support the economy and smooth the path back to growth after the pandemic.
Historically, reducing asset purchases, which is called ‘tapering’, has had a big impact on financial markets, creating heightened volatility in so-called ‘taper tantrums’. In 2013 when Fed chairman Ben Bernanke attempted to taper asset purchases, markets panicked, and bond yields spiked higher.
The risk to the Fed’s policy of waiting for more evidence is that the markets perceive the central bank to be behind the inflation curve which could lead to an even bigger shock when it eventually changes policy.
Judging by the Bank of America’s latest fund manager survey, investors are already ahead of the central bank with around two thirds of respondents saying they expect global inflation and growth to remain above trend. More than a third of fund managers think inflation is now the biggest threat to the global economy.
Lawrence Summers, former US Treasury Secretary and Harvard University economist, has criticised the Fed for creating a ‘dangerous complacency’ in financial markets and misreading the economy.
Even the Federal Reserve’s own Financial Stability Report warned (7 May) that ‘asset prices may be vulnerable to significant declines should risk appetite fall’. It noted ‘a number of nonprice measures suggest that investor appetite for equity risk is elevated relative to history’.
For example, it highlighted the pace of new companies listing on the stock market was at its highest since the late 1990s.
The increasing probability of inflation shocks and elevated risk-taking suggests investors should heed Warren Buffett’s advice to be fearful when others are greedy.
Please continue to check back for our regular blog posts and updates.
Please see below an article from Kristina Hooper, Chief Global Market Strategist for Invesco, which was published yesterday and details her views on the role of Tech stocks:
As you can see from the above article, it is Invesco’s view that tech stocks still have a valuable role to play in an investor’s portfolio. They believe the long-term benefits of tech stocks outweigh the short-term headwinds the industry is currently experiencing.
Tech stocks can still play a pivotal role in constructing a portfolio. However, diversification will remain important. Don’t have all your eggs in one basket.
Please continue to check our Blog content for advice and planning issues and the latest investment, markets and economic updates from leading investment houses.
Please see below for Prudential’s latest announcement regarding Unit Price Adjustments for the PruFund range of funds, received by us late yesterday 25/05/2021:
At this quarter’s review, we’ve announced no change to the Expected Growth Rates (EGR) and upward Unit Price Adjustments (UPA) to a number of the PruFund range of funds this quarter end.
PruFund UPA announcement
Today we’ve announced there’s upward UPAs to the following PruFund funds:
Fund
UPA applied
Prudential Investment Plan
PruFund Growth Fund
+3.56%
PruFund Risk Managed 4 Fund
+5.33%
PruFund Risk Managed 5 Fund
+3.67%
Trustee Investment Plan
PruFund Cautious Pension/ISA Fund
+2.00%
PruFund Growth Pension/ISA Fund
+3.91%
PruFund Risk Managed 2 Pension/ISA Fund
+2.09%
PruFund Risk Managed 3 Pension/ISA Fund
+3.22%
PruFund Risk Managed 4 Pension/ISA Fund
+2.67%
Prudential ISA
PruFund Cautious Pension/ISA Fund
+2.00%
PruFund Growth Pension/ISA Fund
+3.91%
PruFund Risk Managed 2 Pension/ISA Fund
+2.09%
PruFund Risk Managed 3 Pension/ISA Fund
+3.22%
PruFund Risk Managed 4 Pension/ISA Fund
+2.67%
PruFund Risk Managed 5 Pension/ISA Fund
+3.45%
Prudential Retirement Account – Series D
PruFund Cautious Pension Fund – Series D
+2.00%
PruFund Growth Pension Fund – Series D
+3.91%
PruFund Risk Managed 2 Pension Fund – Series D
+2.09%
PruFund Risk Managed 3 Pension Fund – Series D
+3.22%
PruFund Risk Managed 4 Pension Fund – Series D
+2.67%
Flexible Retirement Plan
PruFund Cautious Pension/ISA Fund
+2.00%
PruFund Growth Pension/ISA Fund
+3.91%
PruFund Risk Managed 2 Pension/ISA Fund
+2.09%
PruFund Risk Managed 3 Pension/ISA Fund
+3.22%
PruFund Risk Managed 4 Pension/ISA Fund
+2.67%
International Prudence Bond / Prudential International Investment Bond
PruFund Cautious (Sterling) Fund
+2.00%
PruFund Growth (Sterling) Fund
+2.88%
PruFund Growth (Dollar) Fund
+2.95%
PruFund Growth (Euro) Fund
+2.68%
Please note UPAs also apply to the protected versions of the fund where applicable.
On the monthly PruFund Investment Date, a UPA is applied if the unsmoothed price is:
4%, or more, higher than the smoothed price, for our PruFund Cautious, PruFund Risk Managed 1 or PruFund Risk Managed 2 funds, or
5%, or more, higher than the smoothed price for our PruFund Growth, PruFund Risk Managed 3, PruFund Risk Managed 4 or PruFund Risk Managed 5 funds.
Growth rates aren’t guaranteed. The value of an investment can go down as well as up. Your client may get back less than they have paid in.
More information on the EGRs and UPAs for each product is available on PruAdviser.
Prudential have said that they have had a strong 6 month performance since the 25th November last year. It’s important to note that PruFund funds lag both a rising and a falling market. The increases or reductions in PruFund via UPAs are formulaic and non-discretionary. They are based on the maths and the difference in fund value between the underlying assets and the ‘smoothed’ price.
M & G’s Treasury & Investment Office (TIO) who manage PruFund for Prudential are in the middle of a Strategic Asset Allocation review. Within the next month or two we will find out how they change their assets focusing on long term returns.
The Expected Growth Rates (EGRs) have remained the same. For example on PruFund Growth 5.70% gross per annum. EGRs give you an indication of what the TIO think long term returns will be over 15 years plus.
These upwards Unit Price Adjustments are some very positive news and demonstrate the recovery in the markets as a whole. These UPAs combined with previous UPAs over the past 12 months have brought the majority of the PruFund range of funds back to positions similar to those before the drops caused by the Coronavirus Pandemic.
Hopefully this trend of recovery and positive performance continues as we see mass vaccine rollouts worldwide and lockdown restrictions gradually eased. Although we may not be out of the woods yet and there are no guarantees, this increase in the UPAs is a reason for optimism.
Please see below the latest ‘Markets in a Minute’ article from Brewin Dolphin received late yesterday afternoon – 25/05/2021
Stocks mixed as Fed hints at asset purchase taper talks
Global equities were mixed last week as investors weighed signs of an economic rebound in Europe against the Federal Reserve’s so-called ‘taper talk’.
The S&P 500 and the Dow fell 0.4% and 0.5%, respectively, after minutes from the Fed’s April policy meeting suggested it might start to discuss reining in its accommodative monetary and fiscal policy. The Nasdaq added 0.3% after Friday’s flash US composite PMI output index surpassed expectations.
Over in Europe, signs that the economy is rebounding helped the pan-European STOXX 600 end the week up 0.4%, although gains were held back by concerns about rising inflation. The UK’s FTSE 100 slipped 0.4% as inflation surged and the pound rose against the dollar.
Japan’s Nikkei 225 added 0.8% on higher-than-expected export growth and a surge in manufacturers’ business confidence. China’s Shanghai Composite lost 0.1% as retail sales growth slowed and cases of Covid-19 rose in several provinces.
Equities rebound as tech shares outperform
Stocks recovered some of last week’s losses yesterday as inflation fears receded and technology shares rose.
The tech-heavy Nasdaq was up 1.4% at Monday’s close, while the Dow rose 0.5%, led by Microsoft, Cisco, Apple and Intel. The S&P 500 added 1.0%, with the communication services, information technology and consumer discretionary sectors outperforming.
Gains in technology stocks also boosted stocks in Europe, although several markets were closed for Whit Monday. The pan-European STOXX 600 was up 0.1% and France’s CAC 40 added 0.4%. The FTSE 100 climbed 0.5% to 7,052 as the pound stabilised following a warning from China against excessive speculation in commodities.
The FTSE 100 was down 0.1% in early trading on Tuesday as investors mulled figures that showed UK public borrowing in April was the second highest on record. At £31.7bn, it was £15.6bn less than in April 2020, when the government borrowed £47bn to tackle the pandemic. It was also lower than the Office for Budget Responsibility’s forecast of £39bn.
Fed officials discuss potential taper talk
Minutes from the Federal Reserve’s meeting in late April, released last Wednesday, reflected an overarching dovish sentiment but suggested some Fed officials thought the US central bank should start talking about tapering asset purchases relatively soon.
“A number of participants suggested that if the economy continued to make rapid progress toward the committee’s goals, it might be appropriate at some point in upcoming meetings to begin discussing a plan for adjusting the pace of asset purchases,” the minutes said.
Currently, the Fed is buying $120bn of Treasury securities and agency mortgage-backed securities each month. It has pledged to continue at this pace until it sees “substantial further progress” towards its inflation and employment targets. The meeting was held before inflation data showed a surge in the US consumer price index for April.
Elsewhere, figures released on Friday showed IHS Markit’s flash US composite output index reached a record high of 68.1 in May – well above April’s reading of 63.5 and higher than the consensus forecast. The services business activity index reached 70.1 in May, up from 64.7 in April, marking the fastest pace of growth on record. The manufacturing PMI also rose to 61.5 from 60.5 the previous month.
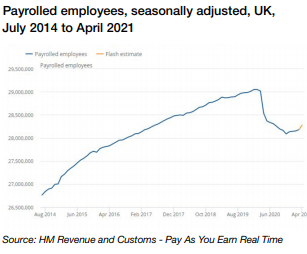
UK jobs market is picking up Last week’s employment data showed the UK labour market is picking up. The number of payrolled employees increased by 97,000 between March and April, the fastest pace since the start of the pandemic. Overall, there were 28.3m payrolled employees in April 2021, which was 257,000 fewer than 12 months ago.
The UK unemployment rate unexpectedly fell to 4.8% for the three months to March, down from 4.9% in February, while the number of job vacancies hit the highest level since the start of the pandemic. Median monthly pay increased by 9.8% year-on-year and is now higher than pre-coronavirus levels.
The labour market data was released the day before figures showed the annual rate of inflation in the UK more than doubled in April to 1.5% from 0.7% in March. Higher petrol prices and gas and electricity bills drove the increase.
Eurozone business activity soars
Business activity in the eurozone grew at its fastest pace in more than three years in May as Covid-19 restrictions were eased. IHS Markit’s flash composite eurozone PMI rose to 56.9 from 53.8, the highest reading since February 2018 and the third successive month of output growth. The services sub-index increased to 55.1 from 50.5, while the manufacturing sub-index came in at 62.8, down slightly from 62.9 in April. All three readings were above analysts’ expectations.
The research also showed new order growth surged to the highest since June 2006, resulting in backlogs of uncompleted orders rising to a degree not surpassed since the series began in November 2002. IHS Markit said this underscored “the growing shortfall of current output relative to demand”. Meanwhile, the roll out of the vaccine meant optimism about the year ahead was the brightest since comparable data began in 2012.
Please continue to check back for our latest blog posts and market updates.
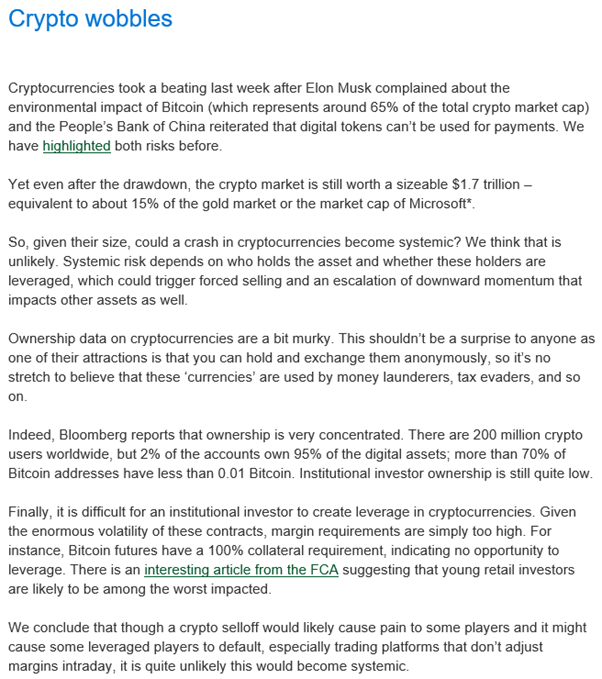
Please see below latest input from Legal & General’s Investment Managers Asset Allocation team outlining their views on markets:
I think the above article helps highlight just how volatile Cryptocurrencies are and also how very concentrated ownership of these assets are. These assets are extremely speculative and caution is advised before investing (gambling?).
Emerging Markets Debt looks like an asset class that could help add value to a portfolio over the long-term, but Currency risk needs to be factored in.
It remains to be seen whether the current bout of inflationary pressure are transitory or longer-term and when Central Banks might intervene to help curb inflation.
Recession was something talked about pre-pandemic, with the consensus from Fund Managers being that we were in late cycle, with a little room for growth. It’s hard to tell where the recession risk lies now given the impact of the Pandemic, but L&G’s Asset Allocation team see this as an issue that is at least 2 or more years away now.
Please continue to check our Blog content for advice and planning issues and the latest investment, markets and economic updates from leading investment houses.