Team No Comments

Why stock markets are worried about inflation

Please see below article received from AJ Bell yesterday morning, which provides a cautionary commentary on the historic effects of inflation and dissects current market behaviour.

Even a reading of 1.5% inflation in the UK’s consumer price index is giving stock markets the jitters, although that it still a very, very, very long way below the sort of levels which gave investors terrible trouble in the 1970s and early 1980s.

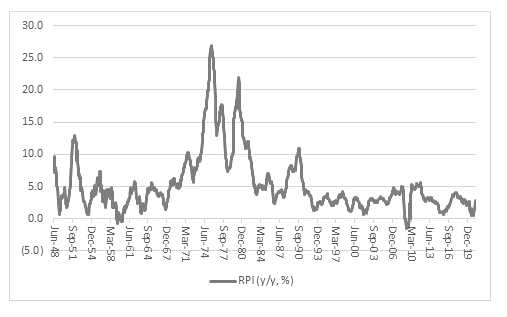
Back then inflation, as measured by the retail price index (for which there is a longer dataset), was roaring away in the twenties. That hurt consumers’ spending power, as their savings lost value in real terms, and dissuaded companies from investing, as the returns on any new projects could not compete with the double-digit interest rates on offer.

Yet the experiences of the 1970s clearly have stock market investors on their guard.

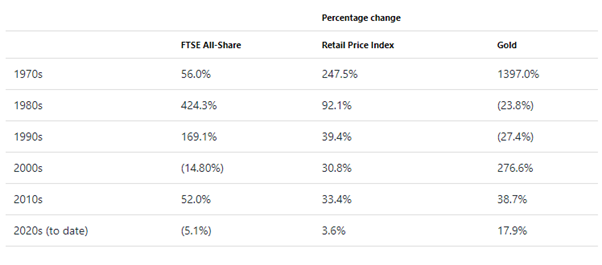
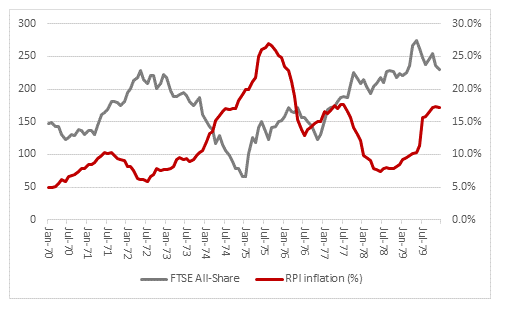
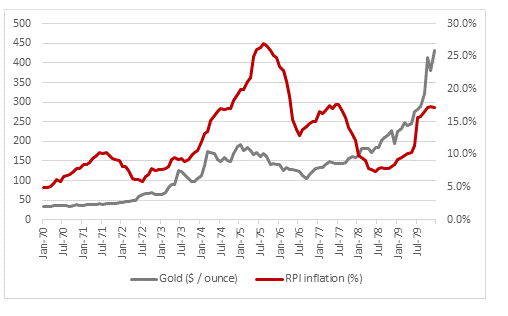
The FTSE All-Share rose by a perfectly respectable 56% in the 1970s, but the retail price index rose by 248%, so equities did not offer as much protection as hoped. Gold did, since the precious metal surged by nearly 1,400%.

Equities came into their own in the 1980s and 1990s as inflation ebbed, interest rates came down and lower returns from cash and bonds persuaded investors to gravitate toward stocks. Gold all but disappeared from view, only to reappear as Governments began to shake the magic money tree in response to the Great Financial Crisis and then came to view such shaking as standard operating procedure in the 2010s and early 2020s.

Investors will also know that the real damage to equity portfolios was done in the late 1970s, when a second wave of inflation hit home, after the appalling state of the UK’s public finances finally caught up with it.

That was also when gold really came into its own, as investors shunned cash and paper assets in favour of ‘real’ assets.

That sequence of events supports the analysis proffered by Jens O. Parrson in his book Dying of Money who studied the surge in American inflation in the 1970s with the even more dramatic surge in Germany in the 1920s:

‘Everyone loves an early inflation. The effects at the beginning of an inflation are all good. There is steepened money expansion, rising government spending, increased government budget deficits, booming stock markets and spectacular general prosperity, all in the midst of temporarily stable prices. Everyone benefits and no-one pays. That is the early part of the cycle. In the later inflation, on the other hand, the effects are all bad. The government may steadily increase the money inflation in order to stave off the later effects, but the later effects patiently wait. In the terminal inflation, there is faltering prosperity, tightness of money, falling stock markets, rising taxes, still larger government deficits and still roaring monetary expansion, now accompanied by soaring prices and ineffectiveness of all traditional remedies. Everyone pays and no-one benefits. That is the cycle of every inflation.

Economists, investors, consumers, savers and above all central bankers will be hoping that Parsson is wrong.

But no-one can ignore how the early building blocks of Parsson’s argument are in place – money supply is rocketing in the US, UK, Europe and Japan; Government deficits are off the clock as they spend like fury to stave off the economic after-shocks posed by the pandemic; asset prices are surging; and calls for yet more spending and stimulus are much louder than those for a scaling back of either fiscal or monetary stimulus. Faith in the existence of a magic money tree that can dispense wealth without consequence is running high.

And yet no central banker can pretend we are in a normal situation or that they are in control. Policies described as emergency measures in 2008-09 are now the norm, as interest rates remain anchored at record lows and Quantitative Easing programmes continue to run at full tilt. Any attempts to row back on those policies prompt financial market volatility and a rapid spill-over in to the ‘real’ economy, as we saw in 2018 and 2019. Global debts continue to accumulate, providing only the weakest of foundations for any economic recovery and ones that are prone to quickly buckling, as we saw globally in 2007-09, in 2011-13 in Southern Europe and around the world again in 2021. Annual Government budget deficits stand at their highest level since the 1940s in many cases and aggregate deficits are in many cases setting new all-time highs on a monthly basis.

Meanwhile, stock markets, cryptocurrencies, non-fungible tokens continue to surge, or at least do so until the threat of rising interest rates, less QE and a drop in the amount of free money with which to idly speculate raises its head once more.

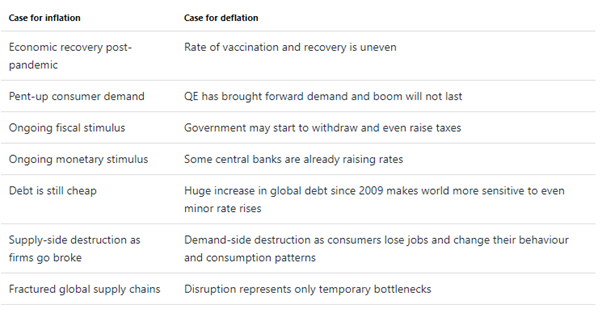
No-one knows what is coming next – inflation, deflation or even stagflation – and investors cannot afford to be too dogmatic about their portfolio allocations, as the three different outcomes require a different response from investors as they seek to augment or at least protect their wealth.

If history is any guide, equities offer some protection against inflation, but with a focus on pricing power, life’s essentials and raw materials. Bonds and cash, both of which are to be avoided in an era of inflation or stagflation, would help in a deflationary environment. And in the case of stagflation, index-linked cash flows such as rents from property, infrastructure projects and index-linked bonds would help, as would gold, at least if the experience of the 1970s is repeated.

Investors therefore need to be prepared for anything with a balanced portfolio that covers all eventualities, because the ultimate outcome is just too hard to predict and also because valuations will reflect different market views at different times.

Just over a year ago, the prospect of inflationary surge was seen as very unlikely and bonds were doing well, shares were doing badly and gold was being completely ignored.

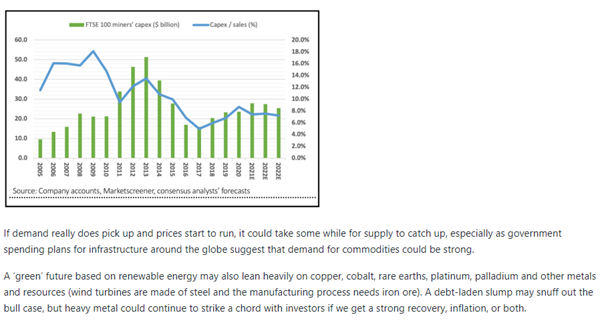
Now, the consensus view is that inflation is indeed coming, as evidenced by how well mining shares and commodity prices have done and sharp falls in bond prices and rapid increases in Government bond yields (albeit from a low base).

Perhaps it is therefore time to start wondering whether it is time to go against the crowd once more.

We will continue to publish relevant content, market analysis and news. Please therefore, check in again with us soon.

Stay safe.

Chloe

24/05/2021

Team No Comments

Should I use a SIPP or an ISA for retirement savings?

Please see below for one of AJ Bell’s latest Investment Insight articles, received by us yesterday 20/05/2021:

‘I have both an index linked personal pension and an employee salary sacrifice pension which was started in 2016. I am hopefully going to finish paying my mortgage in the next two or three years and want to invest an extra £100 a month for retirement.

I am torn between using my Stocks and Shares ISA (which is not anywhere near my annual allowance even if I decide to use this for the £100) or opening a SIPP.

I am aware that the SIPP will offer the basic tax relief top up of 20% and I can take 25% tax free when I crystallise the SIPP, whereas there is no tax to pay whatsoever on any money I withdraw from a Stocks and Shares ISA.

Which would be the better option? Or would a split between the two be a good idea?’

Lee

Tom Selby, AJ Bell Senior Analyst says:

Deciding whether to invest your money in a pension or an ISA will depend on a number of things including your goals and personal circumstances. While the tax impact is also important, it should be considered alongside these other key factors.

If you are willing to keep your money locked up until age 55 (57 from 2028), from a purely tax perspective a pension will usually give you a bigger bang for your buck than an ISA.

This is because pensions benefit from basic-rate tax relief upfront – extra money which can then benefit from compound growth over time. ISAs, on the other hand, are more flexible, benefitting from tax-free withdrawals at any time but offering no upfront bonus.

The income your pension generates – and how it compares to what you might get from an ISA – will depend in part on how you manage your withdrawals.

AN EXAMPLE

Take, for example, someone who saves £1,200 a year – equivalent to £100 a month – in a pension and an ISA. Each contribution to the pension would be topped up with basic-rate tax relief, taking the total amount invested to £1,500 a year.

If both the pension and ISA enjoy 4% annual investment growth after charges, after 30 years the pension could be worth around £87,500 while the ISA could be worth £70,000.

If the pension saver was a higher-rate taxpayer or additional-rate taxpayer, they could also have claimed extra tax relief from the taxman.

While the ISA would be accessible entirely tax-free at any time, a quarter of the pension pot (£21,875) would be available tax-free, with the rest (£65,625) taxed as income. How much they receive from this taxable portion would depend on their rate of income tax.

If we assume there is no more investment growth from the point they access their pension:

If taxable withdrawals are within the personal allowance each year and therefore taxed at 0% then they would get £87,500 of income from their pension;

– If taxable withdrawals are taxed at 20% they would get £74,375 (£21,875 tax-free cash plus £52,500 income after tax) from their pension;

– If taxable withdrawals are taxed at 40% they would get £61,250 (£21,875 + £39,375) from their pension;

– If taxable withdrawals are taxed at 45% they would get £57,969 (£21,875 + £36,094) from their pension.

Where withdrawals cut across two different tax bands the actual tax someone pays will be different to those set out above. But provided pension withdrawals are taxed at 20% or less then, from a purely tax perspective, a pension should deliver more income than an ISA.

OTHER CONSIDERATIONS

There will, of course, be other considerations when choosing between a pension and ISA other than purely the income it could potentially generate.

Flexibility will be important for lots of investors, and on this front an ISA offers much readier access to your cash before age 55 (57 from 2028) than a pension.

The difference in tax treatment on death is also worth bearing in mind. While ISAs will form part of your estate for inheritance tax (IHT) purposes, pensions in most circumstances will not.

In fact, pensions can usually be passed on tax-free to your beneficiaries if you die before age 75, and are subject to income tax when beneficiaries come to access the money if you die after your 75th birthday.

Risk control for the long term is helped by building and holding a range of assets, pension funds, Stocks & Shares ISAs (or similar) and cash. This gives you greater flexibility because you could decide not to draw on your pension assets in times of a market downturn. Holding a variety of assets aids tax free efficiency too.

This three-tiered approach should be discussed with your IFA to ensure it meets your circumstances and objectives for the long term. 

Best Regards

Paul Green DipFA

21/05/2021

Team No Comments

Four truths about inflation and the Fed

Please see the below article from Invesco received late yesterday afternoon:

Key takeaways

The Fed does not have a trigger finger

Just because the Fed reacts negatively to a data point doesn’t mean it’s going to tighten monetary policy at its next meeting.

Some inflation is expected

Time and again, Fed officials have warned that a spike in inflation is likely as the US economy re-opens.

The Fed’s approach has changed

The Fed has gone through a paradigm shift when it comes to inflation targeting.

Last week, investors shuddered as data showed a big rise in prices in the US and a greater-than-expected rise in prices in the eurozone. Stocks sold off, US Treasury yields climbed higher, and market pundits obsessed over inflation. I feel it’s important at this juncture to remind investors of a few truths surrounding inflation and the Federal Reserve.

1. The Fed does not have a trigger finger

Just because the Fed reacts negatively or says it’s surprised by one or more data points doesn’t mean it’s going to tighten monetary policy at its next meeting. Some investors were taken aback by Fed Vice Chair Richard Clarida’s comments last week when he said he was surprised by some recent data points such as the Consumer Price Index, which was much higher than he expected. However, he was quick to reassure: “Honestly, we need to recognize that there’s a fair amount of noise right now, and it will be prudent and appropriate to gather more evidence…” Don’t forget that the Fed’s new catch phrase is “patiently accommodative.” In other words, the Fed is going to err on the side of accommodation and is likely to deliberate extensively before tightening.

2. The Fed anticipates a spike in inflation as the economy re-opens

At a Wall Street Journal conference in early March, Fed Chair Jay Powell explained that, “We expect that as the economy reopens and hopefully picks up, we will see inflation move up through base effects. That could create some upward pressure on prices.” In fact, time and again, Powell and other Fed officials have telegraphed that a spike in inflation is likely as the US economy re-opens. The Fed is ready and accepting of that rise in inflation.

3. We won’t know any time soon if the increase in inflation is temporary or persistent

A temporary rise in inflation is at least partially the result of base effects — in other words, the comparisons to a year ago look distorted given what poor shape the economy was in last spring as the pandemic took hold. In addition, there is currently a mismatch between supply and demand which can drive up prices — think of the supply chain issues that are being experienced right now in some industries and the pent-up demand that is now being exercised as economies re-open. However, these are likely to create only temporary inflation. After all, how many flights can you take and haircuts can you get once the economy re-opens? Clearly, the law of diminishing marginal utility suggests that at a certain point, satisfaction with each additional flight or haircut is reduced.

Now, there are forces that can lead to more persistent inflation. Typically wage increases lead to “stickier” inflation. We have not yet seen a significant rise in average hourly earnings in the United States, and it seems unlikely that will happen quickly given the very substantial amount of labor market slack.

Monetarists would argue that it all comes down to money supply; a significant increase in money supply can spur persistent inflation, and right now we have seen a very significant increase. However, one other key ingredient is usually present as well: an increase in the velocity of money, which we have not yet seen. The quantity theory of money posits that inflation is not just a function of money supply but also the velocity of money. As the St. Louis Fed explained in a brief research note, “If for some reason the money velocity declines rapidly during an expansionary monetary policy period, it can offset the increase in money supply and even lead to deflation instead of inflation.” But even if a money supply increase is enough to spur persistent inflation, this would not occur immediately — it usually occurs with an 18-24 month lag, suggesting we may not see it until late 2021 or early 2022.

4. The Fed’s inflation targeting policy represents a paradigm shift for the Fed

The Fed has gone through several paradigm shifts in the last several decades, and they’ve been transformational. I’m old enough to remember when the Fed didn’t believe in regular communication with the public, when the size of then-Fed Chair Alan Greenspan’s briefcase was the best indicator of what the Fed’s decision on rates would be at the next Federal Open Market Committee (FOMC) meeting. And now of course, the Fed is extremely transparent, working hard to telegraph its views and actions before taking them. Similarly, the Fed had a very different inflation targeting policy before last summer. Its current policy, called Average Inflation Targeting (AIT), means that the Fed’s objective is to push inflation enduringly above 2% and attain full employment before considering tightening. In other words, this new policy enables the Fed to be far more flexible and essentially tolerate economic overheating. This is NOT the Fed of yesteryear, which believed that its role was to take away the punch bowl just as the party was getting started. This Fed might leave out the punch bowl into the wee hours, even as partygoers get drunk.

What does this mean for investors?

This begs the question: what are investors afraid of? Are they afraid of inflation — or the Fed tightening in reaction to inflation? It seems to me that they are far more worried about the latter than the former. That would explain why last week’s negative reaction to signs of inflation was so very short-lived, as Fed officials provided reassurance. And so perhaps investors should be more concerned about the former, especially if the Fed remains “behind the curve” and is unable to easily tame inflation once it tries to. While I must stress that this is far from my base case scenario, it is a risk that needs to be considered since inflation can have a negative impact on some asset classes. If persistently higher inflation were to occur, investors could benefit from exposure to commodities, cyclical stocks, inflation-protected securities, emerging market assets and even dividend-paying stocks as part of a diversified portfolio.

This week there is more potential for volatility, as investors wait with bated breath for the FOMC minutes, which could offer more insight into what the Fed is thinking with regard to inflation and tightening.

Our Comments

The markets are still volatile at the moment but are generally on an upwards trend as you can see from the below chart of the FTSE 100 over the past year:

Source: Google, as at 16:35 BST 19/05/2021

Global markets are increasingly more interconnected and US inflation fears affects the UK markets (and vice versa).

Inflationary fears will continue as will the volatility however as we always state, its important to remain calm and ride the volatility out.

Andrew Lloyd

20/05/2021

Team No Comments

Brewin Dolphin – Markets in a Minute

Please see below the latest ‘Markets in a Minute’ article from Brewin Dolphin received late yesterday afternoon – 18/05/2021

Stocks slide as higher inflation sparks fears of rate hike

Global stock markets fell last week after a surprise surge in US inflation sparked fears of higher interest rates.

US stocks slipped from record highs, although a rally later in the week helped to moderate losses. The S&P 500 fell 1.4%, the Dow declined 1.1%, and the Nasdaq slid 2.3% as technology and growth stocks bore the brunt of interest rate jitters.

European indices were mixed. Germany’s Dax was largely flat, Italy’s FTSE MIB gained 0.6% and the pan-European STOXX 600 declined 0.5%. The UK’s FTSE 100 slid 1.2% as the pound rallied against the US dollar following local election victories for the Conservatives.

In Japan, where Covid-19 infection rates are accelerating, the Nikkei slumped 4.3% on news that a state of emergency will be declared in three more prefectures. In contrast, the Shanghai Composite rose 2.1% following a 6.8% surge in China’s producer price index – the largest gain since 2017.

Indian variant sparks lockdown easing fears

UK and European stock markets extended losses on Monday as the spread of a Covid-19 variant first identified in India raised concerns about the relaxation of lockdown measures.

On 17 May, lockdown restrictions were eased in England, Wales and most of Scotland, but prime minister Boris Johnson warned that “we must take this next step with a heavy dose of caution”. He said the Indian variant could make the next step of easing, due on 21 June, more difficult. The FTSE 100 ended the session down 0.2%, while Germany’s Dax slipped 0.1%.

Markets in Asia were mixed on Monday amid a raft of economic data from China. Industrial output grew by 9.8% year-on-year in April, in line with expectations, while retail sales grew by 17.7%, far worse than the 25.0% forecast. The Shanghai Composite added 0.8%, whereas Japan’s Nikkei fell by 0.9%.

Inflation fears persisted on Wall Street, sending the Nasdaq down 0.4%. The S&P 500 and the Dow shed 0.3% and 0.2%, respectively.

The FTSE 100 was up 0.5% at Tuesday’s open after data from the Office for National Statistics showed the UK unemployment rate fell again between January and March to 4.8%.

US core inflation jumps 0.9% in April

Inflation dominated the news headlines last week. The latest US consumer price index (CPI) revealed core inflation (excluding food and energy) jumped by 0.9% in April. This was the biggest monthly rise in nearly four decades and far higher than the 0.2% rise economists were expecting. The headline CPI increased by 4.2% on an annual basis, exceeding the 3.6% forecast.

On Wednesday, Federal Reserve vice chair Richard Clarida acknowledged that he was surprised by the jump in consumer prices, but said he still expects the increase to be temporary. He added that the previous week’s disappointing jobs growth report proves the ‘wisdom’ of keeping monetary policy loose.

Last week also saw the release of the latest US retail sales data, which showed sales unexpectedly stalled in April as the boost from stimulus cheques faded. Economists had been expecting a rise of between 0.8% and 1.0% from the previous month. However, the increase came after a 10.7% surge in March, an upward revision from the previously reported 9.7% increase.

Economy recovering in Europe

Rising vaccination rates and the prospect of the easing of lockdown restrictions prompted the European Commission to increase its economic growth forecasts for the next two years. The euro area is expected to grow by 4.3% in 2021 and 4.4% in 2022, up from the previous forecast of 3.8% for both years. The broader EU economy is expected to grow by 4.2% in 2021 and 4.4% in 2022.

Meanwhile, the rapid roll out of the vaccine boosted UK gross domestic product (GDP) by a stronger-thanexpected 2.1% in March, the fastest monthly growth rate since August 2020. This helped to reduce the rate at which the economy contracted in the first quarter to 1.5%. However, March’s GDP was still 5.9% below the level seen in February 2020.

Chinese producer prices surge in April

Over in China, factory gate prices rose at the fastest pace in three-and-a-half years in April as raw materials prices surged. The producer price index jumped 6.8% from a year earlier, following a 4.4% increase in March. The consumer price index (CPI) rose by a less-than-expected 0.9% because of lower food prices.

Separate figures showed auto sales surged 8.6% in April from a year ago, marking the 13th consecutive month of growth, according to the China Association of Automobile Manufacturers. This means the country’s vehicle market has now fully recovered to pre-pandemic levels. In the first four months of 2021, new vehicle sales surged by almost 52%.

Weekly updates like these from Brewin Dolphin help us keep up to date with that is happening in the markets.

Please continue to check back for our latest blog posts and market updates.

Charlotte Ennis

19/05/2021

Team No Comments

The Rebound Race

Please see below article received from Legal & General yesterday afternoon, which provides stock market analysis and an update on the progress of global economic recovery. 

Economic clock

We increased our medium-term risk-taking view to +1 (on a range of -3 to +3) in December as it became clear that the vaccine rollout would make rapid progress through the first half of 2021. This view is based on three considerations: the economic cycle, valuations, and systemic risk.

We scored the economic cycle at +2 in December, but believe it is now time to downgrade that to +1. This quarter, US output is expected to exceed its pre-pandemic level and we expect it be about 1.5% above its pre-pandemic trend in the fourth quarter. Meanwhile, we forecast about 4% unemployment in the US by the end of the year, just 0.5% above the pre-pandemic level. So, while we expect rapid growth – we are above consensus on that – and markets remain backed by extensive ongoing policy support, we believe the economy will start to run out of easy expansionary space within 12 months.

The valuations dial remains neutral; despite a 10% S&P 500 index return in the year to date, given earnings growth we don’t feel the move is large enough for a downgrade. Relative valuations remain a positive factor too; as an example, while the gap between earnings yields and bond yields has narrowed, it remains well above long-term averages. On absolute valuations, price-to-earnings ratios are similar to June 2020, but we expect earning upgrades and so believe “real” multiples are lower than the headlines suggest.

Finally, on systemic risk we have upgraded from -1 to 0. This reflects the amalgam of factors that have the potential to derail markets and the economy but are impossible to capture through our normal cyclical analysis. Given countries’ limited space for further monetary easing, US-China relations, and Eurozone debt issues, we have been negative on this factor for most of recent history. However, each of the three major economic blocs has shown impressive institutional resilience in the past year: US civil society bent but didn’t buckle in the aftermath of the election, Europe took a (limited) step towards debt mutualisation, and China has navigated the pandemic remarkably well. Institutions have passed a lot of difficult tests.

So, overall, we remain +1 for the medium term, but somewhat more cautious in how we apply that score. We’ll be more prepared to sell into strength while still planning to buy any significant dips.

Off to a flyer

US core CPI’s 0.9% monthly increase in April was easily the largest since the early 1980s and beat expectations by 0.6%. Everybody knew inflation would pick up in the next few months, but this is a much faster jump than expected.

While dramatic, we think it is mainly transitory as re-opening and supply disruptions combine. For example, used-car prices rose 10% in a month and that alone added 0.3%. Airfares and hotels added 0.2% between them too. The stickier elements of inflation like rent, education and healthcare remained more subdued.

There is certainly a case where the inflation momentum continues and becomes self-perpetuating as excess consumer savings, fiscal stimulus and low interest rates drive demand, all supported by lower commodity inventories and chip shortages. A combination of low unemployment and higher prices in 2022 could lead to wage rises that then spiral into higher prices.

That said, there are also structural deflationary forces that have put downward pressure on global inflation over the past decade and those still apply. In particular, we’ve previously outlined technology’s role and also that of globalisation in creating a more flexible labour force with less bargaining power.

There are even arguments that the COVID-19 crisis will intensify those structural deflationary forces; technology adoption has accelerated and remote working has dramatically increased intra-country workforce flexibility.

So, on balance, we don’t expect sustained inflation pressure and are short US inflation to push back on the increasingly positive narrative, with US 5y5y inflation already 0.5% above pre-COVID levels.

Tech tock

It’s been a tough time for tech, with a 10% correction for Nasdaq stocks versus the S&P 500 index since mid-February. This was the biggest relative fall of the past decade, coming after the biggest rise. Inevitably that’s leading to a lot of headlines on inflation as the driver, high tech valuations, and tech being over-loved and vulnerable – a timebomb waiting to go off. We disagree.

We think that rising inflation has been largely coincidental, not causal. There’s no consistent correlation between inflation or bond yields and tech; it’s in the middle of the pack as a sector. Instead, we link tech’s performance more closely to higher economic growth. Technology is perceived as offering secular growth and so is more attractive when growth elsewhere is weak, so now with the recovery other sectors are re-rating relative to tech. As growth momentum (e.g. purchasing managers’ indices) slows, pressure on tech should moderate. For the longer term, there is an argument that tech will do well if there is sustained inflation, as it implies sustained wage pressure which in turn encourages companies to automate and innovate.

On valuations, price-to-earnings ratios are back to pre-COVID levels despite strong earnings. That isn’t outright cheap but corrected any outperformance in excess of what relative earnings have done. We would expect structurally higher future tech growth as the pandemic has permanently shifted attitudes in areas like remote working and consumers’ online habits, in our view.

Finally, on sentiment, recent broker surveys show large moves out of tech. While price action suggests there are still plenty of owners, we are a long way from the extremes seen in the past with sectors like banks preferred on the basis of their higher expected growth in earnings.

We will continue to publish relevant articles and helpful market updates as the UK Government continues to push for mass-vaccination, with people aged 38-39 able to book an appointment from Thursday.

Stay safe.

Chloe

18/05/2021

Team No Comments

A.J. Bell – Why heavy metal continues to strike a chord with investors

Please see below an article received from A.J. Bell which was received yesterday (16/05) and details their views on inflationary pressures and where industrial metals and mining could play a role:

Please continue to check our Blog content for advice and planning issues and the latest investment, markets and economic updates from leading investment houses.

Please keep safe and healthy.

Carl Mitchell – Dip PFS

IFA and Paraplanner

17/05/2021

Team No Comments

Everything you need to know about the state pension

Please see below for one of AJ Bell’s latest articles, received by us yesterday 13/05/2021:

WHAT IS THE UK STATE PENSION AGE?

The current UK state pension age is 66 for both men and women. It used to be the case that women received the state pension at age 60 and men at 65, but this was viewed as discriminatory and so successive Governments legislated to equalise the state pension ages of the sexes.

This happened in 2018, at which point the state pension age for men and women was slowly increased to 66 by 2020.

The state pension age is scheduled to rise again to 67 between 2026 and 2028. As with the increase to age 66, there will be a two-year transition where some people will have a state pension age somewhere between 66 and 67.

After 2028 the next intended increase in the state pension age is to 68 between 2044 and 2046. However, the Government has stated it wants to accelerate this move so it happens seven years earlier, between 2037 and 2039.

I RETIRED BEFORE 6 APRIL 2016 – HOW MUCH STATE PENSION WILL I RECEIVE?

For those who reached state pension age before 6 April 2016, there were two primary components: the basic state pension and additional state pension. This additional element consisted of:

  • Graduated Retirement Benefit built up between 6 April 1961 and 5 April 1975;
  • State Earnings Related Pension Scheme built up between 6 April 1978 and 5 April 2002;
  • State Second Pension built up between 6 April 2002 and 5 April 2016.

The full basic state pension is worth £137.60 a week in 2021/22 and rises each year in line with the highest of average earnings, inflation or 2.5% (the ‘triple-lock’). You needed at least 30 years’ National Insurance contributions to qualify for the full amount – for those with less than this, a deduction would have been made.

The triple-lock does not apply to any additional state pension entitlements you have, which instead increase each year in line with CPI (consumer prices index) inflation.

I RETIRED ON OR AFTER 6 APRIL 2016 – HOW MUCH STATE PENSION WILL I RECEIVE?

The Government decided the state pension system was too complicated and so, for those who reached state pension age on or after 6 April 2016, a reformed system was introduced.

Rather than having two tiers of state pension – the basic and additional state pension – people now build up entitlements to a flat-rate amount. In 2021/22 the full flat-rate state pension is worth £179.60 a week and also increases in line with the triple-lock.

You need to have at least a 10-year National Insurance contribution record to qualify for any state pension under the reformed system, and a 35-year National Insurance contribution record to qualify for the full amount.

Those who had built up state pension entitlements under the old system and had not reached their state pension age before 6 April 2016 had a ‘foundation amount’ calculated. This foundation amount was the higher of:

  • Total benefits built up under the basic state pension and additional state pension, with a deduction made to take account of any years the individual was ‘contracted-out’;
  • Total benefits the individual would have built up had the reformed state pension been in place at the start of their working life, with a reduction applied where the individual was contracted-out.

The idea behind this was to ensure those who had built up entitlements under the old system which were more valuable than the reformed state pension would not lose out.

Anyone with a foundation amount equal to the full flat-rate state pension at 5 April 2016 would not have been able to build up any extra state pension – even if they add more qualifying years to their National Insurance contributions record.

Those with a foundation amount below the full flat-rate state pension could continue to build up qualifying years via National Insurance contributions and boost their state pension entitlement.

People with a foundation amount worth more than the flat-rate state pension would receive the full flat-rate amount plus a ‘protected payment’ to reflect the extra entitlement built up under the old system. They would not gain any extra pension for further qualifying years they accrue.

While the flat-rate element of this pension will rise in line with the triple-lock, the protected payment increases by CPI inflation only.

WHAT IS ‘CONTRACTING-OUT’ AND HOW COULD IT AFFECT MY STATE PENSION ENTITLEMENT?

‘Contracting-out’ was an option previously open to people whereby, in exchange for lower National Insurance payments, employees agreed to opt-out of the additional state pension, meaning they would not build up an entitlement towards it.

For those reaching state pension age after 5 April 2016, any years they contracted-out will be deducted when figuring out your foundation amount.

You can check if you were contracted-out by contacting your pension provider or reviewing an old payslip. If you don’t have either, try the Government’s pension tracing service here.

CAN I DEFER TAKING THE STATE PENSION?

It is up to you to claim your state pension from the Department for Work and Pensions. However, it is also possible to defer taking your state pension – and you’ll receive an uplift for doing so. The level of this uplift will depend on when you reached state pension age.

For those who reached state pension age before 6 April 2016, the rate of uplift is 1% for every five weeks you defer, subject to a minimum deferral period of five weeks. This works out at a 10.4% increase in your state pension if you defer for 52 weeks.

Based on the 2021/22 basic state pension of £137.60 per week, this works out at an extra £14.71 per week if you deferred for one year.

For anyone who reached state pension age on or after 6 April 2016, the deferral rate is 1% for every 9 weeks they defer, or just under 5.8% for every 52 weeks.

This increase is applied to the flat-rate state pension. Based on someone receiving the full flat-rate state pension for 2021/22 of £179.20 a week, a person who deferred for 52 weeks would get an extra £10.42 a week.

Both of these examples assume there is no annual increase in the value of the state pension. If there is an annual increase, the amount you receive could be larger.

SHOULD I DEFER TAKING THE STATE PENSION?

Whether or not state pension deferral is the right option will depend on your personal circumstances.

For some it simply won’t be possible as they need the state pension income as soon as possible, while for others it might depend on their health and lifestyle. But if you are in good health then it could be worth considering.

Take someone who reaches age 66 in 2021/22 and is entitled to the full flat-rate state pension of £179.60 a week in 2021/22. If they defer taking this income for one year they will forgo £9,339.20 in return for an extra £10.42 a week for the rest of their life.

SO THE KEY QUESTION IS: AFTER HOW LONG COULD YOU ‘BREAK EVEN’?

Based on the state pension increasing by 2.5% each year, it could take 15 years to take as much total income via deferral as you could have done by taking the state pension at age 66.

For someone with a state pension age of 66, this implies the point at which they might be in ‘profit’ from deferring the state pension could be around age 81.

Given average life expectancy for a 66-year-old man is 85 and a 66-year-old woman is 87, this suggests that, provided you are in good health, delaying receiving your state pension could pay off financially.

State Pensions are a complex area as legislation has changed frequently over the last few decades. Whether or not you should draw on your State Pension at your State Pension age depends on your own specific circumstances. It’s a good subject to pick up with your I.F.A.

A great starting point would be to get an up-to-date State Pension forecast, these are the contact details for the dwp:

  • Or call the Future Pension Centre on 0800 731 0175 and request a paper copy

Please continue to utilise these blogs and expert insights to keep your own holistic view of the market up to date.

Keep safe and well.

Paul Green DipFA

14/05/2021

Team No Comments

Will savings power the post Covid-19 economic recovery?

Please see the below article from Invesco received late yesterday afternoon:

Key takeaways

  1. Covid-19 saw net savings of the US household sector surge to 20% of GDP
  2. However, this increase was offset by an increase in net borrowing by both the corporate and government sectors
  3. Is it plausible to argue that high savings will drive a strong economic recovery?

We believe the recovery following the Covid-19 pandemic will be stronger than, for example, the recovery following the GFC, and stronger than consensus forecasts. However, we do not sign up to the theory that this will be driven by excess savings.

High ‘savings rate’

A popular argument currently is that the relatively high ‘savings rate’ across advanced economies will provide powerful fuel for the economic recovery when the Covid-19 pandemic is finally under control.

On its face, this argument seems plausible; if people have forgone spending in the past and have accrued excess savings these can surely be spent in the economy when it is safe and legal to do so. We know that money has a fairly stable relation to income (known as the income velocity of circulation), but is the same true for savings?

There are two problems with the ‘excess savings will be spent’ argument; first, there is an empirical problem when the data is analysed and second there is a theoretical problem when the argument is considered rationally. Here, we focus on the US economy due to the availability of the data, but the analysis is equally as applicable to any economy.

First, we need to define which ‘savings rate’ we are talking about to be consistent. One can choose either an aggregate savings rate for the whole economy (either gross or net of capital consumption i.e. depreciation) or a sectoral (most often, household) savings balance.

An aggregate savings rate reflects overall investment rates (as opposed to consumption), whereas a sectoral savings balance reflects net borrowing and lending between sectors of an economy. These two different definitions are fundamentally different understandings of what ‘savings’ consist of and how they affect economic growth.

Both types of savings rates will be analysed empirically and theoretically.

The aggregate (or gross) savings rate

Gross savings rates have a moderately positive, statistically significant correlation with both real GDP growth and nominal GDP growth. Between 1950 and 2020 in the US, higher gross savings rates were associated with higher growth rates in both real GDP[1] and nominal GDP[2].

Furthermore, net savings rates also show a moderately positive, statistically significant correlation with both real GDP growth and nominal GDP growth.

For example, an increase of 1% in the gross savings rate relative to GDP roughly corresponds to a 46 basis point (bps) increase in real GDP growth, and an 81bps increase in nominal GDP growth (measured on a percent change on previous year basis).

The rationale behind this relationship is simple; if a person or economy chooses to invest their capital (either directly or indirectly via financial markets) in productive endeavours instead of consuming goods or services, this increases the productive capital stock and boosts potential economic output.

The personal (or household) savings rate and sectoral balances

In stark contrast, personal (household) savings rates have zero to low positive, statistically significant correlation with both real GDP growth and, to a lesser extent, nominal GDP growth. Between 1960 and 2020 in the US, higher personal savings rates were not associated with higher growth rates in either real GDP[3] or nominal GDP[4].

To understand why this is the case, consider Figure 1 which contains data taken from the US Financial Accounts.

Figure 1. US sectoral balances (% of GDP, 4-quarter moving average)

The chart tracks the net lending/borrowing between the four key sectors of the US economy, measured as a percentage of GDP (household, corporate – financial and non-financial — government, and external.

The household sector here represents personal savings; the corporate sector represents net lending/borrowing of corporations both financial and non-financial; for the government sector we show the fiscal balance (whether in surplus or deficit); and the overseas (or external) sector is represented by the current account balance (with the opposite sign to show capital inflows or outflows).

Net lending/borrowing across the whole economy (including foreign savings flows) must ultimately sum to zero, as any borrowing (a liability) must be matched by lending (an asset), and in double entry bookkeeping the two must balance.

When Covid-19 first hit the global economy in early 2020, the net savings of the US household sector rose to a historically high level of 20% of GDP. Simply put, spending by households collapsed as social restrictions were introduced and household savings rose commensurately.

Net savings vs net borrowing

However, this increase in net savings by households was reflected in an increase in net borrowing by both the corporate sector and the government sector. Corporates drew down credit lines in the dash-for-cash phenomenon experienced between March and May 2020.

At the same time, the government issued an incredibly large amount of securities to pay for the fiscal response to Covid-19, including unemployment benefits and public health spending relating to the virus.

To understand the effect on overall spending, whenever a particular sector increases its spending, we also need to know how this new spending is funded.  If, for example, the government sector increases its spending, and this spending is funded entirely by less spending from the household sector (as was the case in 2020), overall spending is unchanged.

The same argument can be made for other sectoral balances. It is this key insight that undermines the argument that excess savings in the household sector will power the economic recovery.

As previously mentioned, there is nevertheless a relatively strong correlation between gross/net savings and real/nominal GDP growth. In contrast to personal savings, there has not been an increase in gross or net savings ratios, as evidenced in Figure 2.

Figure 2. US gross and net savings (% of GDP)

Since 1950, gross and net savings rates have closely tracked each other (albeit with a difference of about 16-17 percentage points) and have tended to fall as the US has developed into a more consumption-led economy.

The Covid-19 impact and recovery

Prior to the Covid-19 pandemic, gross and net savings ratios were stable at 20% of GDP and 3% of GDP respectively. Both gross and net savings ratios fell in the second quarter of 2020 to very low levels, which had only ever been reached or exceeded (on the low side) in the period following the GFC.

Since then, there has been a recovery in both savings ratios, but only to pre-Covid-19 levels of around 20% and 2.5% of GDP respectively. Therefore, there has been no material increase in gross or net savings during Covid-19, and the corresponding increases in real or nominal GDP growth cannot be expected to materialise.

In conclusion, analysing both aggregate savings and net sectoral savings yields little evidence that the economic recovery following the Covid-19 pandemic will be driven by excess savings.

We do believe, however, that the recovery following the Covid-19 pandemic will be stronger than, for example, the recovery following the GFC, and stronger than consensus forecasts. The stronger recovery will not be driven by excess savings, but by excess money balances relative to income (and technically by base effects also).

This will manifest firstly in strong real economic growth in 2021-22, and then, ultimately, in higher nominal growth. We believe this will also include a period of inflation in 2022-23 higher than the figures the US Federal Reserve is currently projecting.

Please continue to check back for our regular blog updates.

Andrew Lloyd

13/05/2021

Team No Comments

Brewin Dolphin – Markets in a Minute

Please see below this week’s Markets in a Minute update from Brewin Dolphin – received late yesterday afternoon – 11/05/2021

Markets mixed as investors rotate out of growth stocks

Equities were mixed last week as strong earnings results competed with a renewed rotation out of growth stocks.

The shift to higher-yielding value stocks weighed on the technology-heavy Nasdaq, which slid 1.5% in its worst weekly performance in two months. The S&P 500 and the Dow rose by 1.2% and 2.7%, respectively, after a rally on Friday helped to erase losses from earlier in the week.

The pan-European STOXX 600 gained 1.7% following better-than-expected earnings results and encouraging economic data. Germany’s Dax added 1.7%, while the UK’s FTSE 100 surged 2.3% to end its holiday-shortened four-day week above the 7,000 mark.

In Asia, several indices were closed on Monday through Wednesday for public holidays. Japan’s Nikkei gained 1.9% amid optimism about the global economic recovery, whereas China’s Shanghai Composite ended the week 0.8% lower.

Sterling reaches highest level since February

The FTSE 100 slipped 0.1% to 7,124 on Monday after the pound surged to its highest level against the dollar since February. Some of the factors behind the surge were the upcoming easing of lockdown restrictions, dollar weakness following Friday’s disappointing US payrolls report, and the Conservative Party’s victories in last week’s local elections.

US stocks also closed lower on Monday as the rotation out of growth stocks continued. The Dow slipped 0.1%, the S&P 500 declined 1.0% and the Nasdaq slumped 2.6%, marking its worst session since March.

 European markets were sharply lower at Tuesday’s open, with the STOXX 600 down 1.6% and Germany’s Dax and France’s CAC 40 both down 1.7%. The FTSE 100 tumbled 1.9% following losses in Asia-Pacific markets overnight. Engineering group Renishaw and airline group IAG were among the top fallers in the blue-chip index.

US jobs data disappoints

After a flurry of data that suggested the US economy was roaring back to life, last week’s jobs figures came as a disappointment. Non-farm payrolls increased by just 266,000 in April, far lower than the anticipated one million new jobs. The unemployment rate rose to 6.1%, which was worse than the expected 5.8% rate.

US non-farm payrolls

Although the figures were disappointing, they lend weight to the Federal Reserve’s case for maintaining its accommodative monetary policy. Stocks rallied on Friday after the data helped to ease fears about an imminent rise in interest rates.

Elsewhere, the Institute for Supply Management’s gauge of manufacturing activity stood at 60.7 in April, below consensus estimates of around 65.0 and four points lower than in March. US services also grew at a slightly slower pace in April, with the index falling to 62.7 from March’s all-time high of 63.7.

BoE upgrades UK growth forecast

On Thursday, the Bank of England increased its forecast for UK GDP growth to 7.25% in 2021, up from its previous forecast of 5.0%. This would be the fastest growth rate since 1941’s 8.7% expansion, but it follows a contraction of 9.9% in 2020 – the worst for more than three centuries.

Andrew Bailey, the Bank’s governor, told an online news conference that the strength of the economic recovery needs to be put into perspective.

“Let’s not get carried away,” he said. “It takes us back by the end of this year to the level of output we had essentially at the end of 2019 pre-Covid. So that is good news in the context of where we’ve been, but it still means that two years of output growth have been lost to date.”

The upgrade to forecasts followed a better-than-expected economic performance during the third national lockdown at the start of the year. The economy shrank by 1.5% in the first three months of 2021, better than the Bank’s forecast of a 4% contraction.

Eurozone retail sales beat forecasts

There was good news on the eurozone’s economic recovery last week, with the latest retail sales data revealing month-on-month growth of 2.7% in March, thereby beating consensus forecasts. This marked the second monthly increase in a row. Germany and the Netherlands saw particularly strong growth of 7.7% and 8.4%, respectively.

Meanwhile, IHS Markit’s eurozone composite PMI rose to 53.8 in April, the highest since July 2020. The services sub-index rose to 50.5 – moving above the 50.0 figure, which separates growth from contraction, for the first time in seven months.

Europe’s vaccination programme is also gathering pace. As of 9 May, 27.9% of the European Union’s population had received at least one vaccine dose. In Europe as a whole, the figure was 24.1%, according to Our World in Data.

Please continue to check back for our regular blog posts and updates.

Charlotte Ennis

12/05/2021

Team No Comments

Weekly Market Commentary – Weaker than expected US jobs report splits market opinion

Please see below commentary received from Brooks Macdonald yesterday evening, which provides analysis of the market’s response to political events in the UK and economic developments in the US.

A significantly weaker than expected US jobs report leaves markets baffled

Markets were left baffled on Friday as the US employment report sharply missed expectations, making a US Federal Reserve (Fed) taper of asset purchases in June less likely. Equity markets rallied, with technology performing after a difficult week for growth equities.

The market was expecting around one million new jobs to have been created in the US in April but the final number, 266,000, was far below those lofty expectations1. As commentators scrambled to explain the numbers, there are broadly two camps, one group concluding that this reflects difficulty in making hires, the other that the recovery has less momentum than hoped. The truth will likely lie between these two but President Biden cited the report as evidence of the need for the stimulus that the White House has planned for this year. One of the theories for why the jobs number was so weak is that fiscal support is so large, there is less incentive to take on work, effectively saying that fiscal spending is crowding out private sector employers. If this is the case, additional stimulus could make this imbalance even starker. This could of course just be another short-term demand and supply imbalance and one that will be resolved over the coming quarters, as things return closer to normality.

A strong showing for the Conservatives last week may open legislative policy options

Sterling has begun the week on a stronger note, as investors view the lack of Scottish National Party majority (just) as reducing the risk of an imminent independence vote. Pro-independence parties still have a majority in the Scottish Parliament, however the results, on the margin, reduce the urgency of this question for markets. Tomorrow sees the Queen’s Speech which, given the recent by-election successes from the Conservatives, may be more legislatively ambitious than previously imagined. 

US CPI is released on Wednesday and is expected to contain some substantial year-on-year gains

Friday’s employment report has led to much confusion, particularly as the two interpretations end with contrasting inflationary and deflationary conclusions. This week we will see the unveiling of the April US CPI number which is expected to creep up to 3.6% year-on-year on a headline basis and 2.3% on a core basis (excludes energy and food)2. We are entering the period where the year-on-year comparison is flattering the inflation figures, but it will be interesting to see if bond markets can hold their nerve in the face of these figures, even if they ultimately prove transitory.

We will continue to publish market updates and relevant content as the UK approaches a further relaxation of lockdown rules. Please check in again with us soon. 

Stay safe.

Chloe

11/05/2021