Please see below an article uploaded by Cover Magazine last week and received on 24/07/2020, detailing scammers efforts to exploit people during the ongoing Coronavirus pandemic:
Research by Aviva has shown that unscrupulous tactics and fraudulent communications related to financial services products have risen as a result of coronavirus.
According to the Aviva Fraud Report, suspicious emails, texts and phone calls related to health insurance have increased by 15% since the pandemic – up from 11% pre-Covid (1 January 2019 – 29 February 2020) to 27% during Covid (1 March – 15 June 2020).
For life insurance, the percentage of people who reported receiving suspicious communication were up 10% – from 14% to 24% – during this period.
This compares to a 7% rise in car insurance, 3% rise in pensions and 2% increase in annuities related scams.
According to the report, a typical health and life insurance scam involves a cold call telling consumers “It’s time to review your policy”. The fraudsters will claim they’re from a reputable insurance company or that they’ve been asked to do this by the regulators – all in a bid to gain trust. They may offer lower premiums but what they don’t mention is that the lower premium also means reduced cover – often leaving the consumer with a worthless policy.
The survey of 2009 Brits also found one in five (22%) reported having been targeted by suspicious communications which mentioned coronavirus – which equates to 11.7 million people in the UK.
Almost half (46%) said they didn’t report these suspicious communications, even though they suspected it was a financial scam. The most common (41%) reason given was because they didn’t know who to report the communication to.
Peter Hazlewood, group financial crime risk director at Aviva, said: “While the types of financial scams are generally the same as those before the pandemic, fraudsters are exploiting the pandemic to take advantage of people when they are at their most vulnerable. They are using coronavirus as a pretext to lure potential victims. The scams range from attempts to sell people unsuitable insurance to, at worst, stealing their entire retirement savings. The impact on victims is not just financial either, it has a detrimental effect on people’s mental wellbeing too.”
The research found that one in 12 (8%) of those surveyed have been the victim of a financial scam which related to coronavirus. Of those, 41% said being the victim of a scam negatively affected their mental health.
In June this year, Action Fraud reported £5million having been lost to fraud since February – a figure likely to be far higher due to a lack of reporting. Hazlewood added: “It’s clear from our research that fraudsters will use whatever tactics necessary to get hold of people’s hard-earned money. If you’re interested in getting a lower premium or taking out a new insurance policy, do a bit of research yourself – and don’t be forced into anything by unexpected phone calls from strangers. If you’re not sure whether a financial services company or a communication is legitimate, report it – to us, Action Fraud or the Police. And, while this may feel like an unsettling time for many, the advice we’d give to people is not to panic. When it comes to investments, decisions made in haste and under stress are rarely good ones.”
It is important to remain vigilant with your data and if you have received a communication that you are unsure of, please contact your provider or financial adviser for further details.
Please continue to check our Blog content for advice and planning issues and the latest investment, markets and economic updates from leading investment houses.
Please see article below from AJ Bell Youinvest on the potential capital gains tax hike – received 23/07/2020.
How to beat the potential capital gains tax hike
The tax system could soon change to help the Government raise money to cover some of its Covid-19 support efforts
Thursday 23 Jul 2020 Author: Laura Suter
Chancellor Rishi Sunak has signalled he is looking to shake up how capital gains tax (CGT) is paid, which could leave taxpayers with a higher tax bill.
Sunak has asked the Office for Tax Simplification to look at how CGT is structured, whether the tax can be simplified and if more help can be given to individuals in the administration of the tax.
While he doesn’t explicitly say so, many people assume that the timing of the review indicates the Chancellor could be looking at changing the tax as one way to raise money in order to pay for the Government’s cost of the current Covid-19 pandemic.
The Government has spent a large amount of money on helping the country to stay afloat during the current crisis and everyone expects this year’s Autumn Statement to reveal how it plans to pay for this support. While additional Government borrowing is one solution, tax hikes may also be on the agenda.
The review will look at the differences between the CGT system and the income tax system, how private residence relief works and the reliefs and exemptions on offer.
PUBLIC OPINION
The move might not be entirely unpopular with the British public. Research from AJ Bell showed that two thirds of people think we have a responsibility to contribute towards the cost of the recent measures.
When questioned, the most popular tax to increase was either dividend taxes or CGT, with 37% of respondents thinking it was acceptable to raise those taxes. This was followed by a third of people who said income tax and 22% who said inheritance tax.
WHAT COULD CHANGE?
Changing tax rates: One area that may change is the rates charged on CGT (see below for current rates). There is a big difference between the rates charged for income tax and CGT.
An additional rate taxpayer, for example, would pay 45% tax on any income they make over their personal allowance, but only 20% on their investment gains. One thing the Government could do is bring these rates in line with each other.
Cutting allowances: In a similar vein to above, individuals have a tax-free rate for their income and for their capital gains – currently £12,500 before income tax kicks in and £12,300 for CGT.
These allowances could be brought together, so someone only has one lot of £12,500, for example, before they incur tax. This would bring lots more people into the bracket of having to pay CGT.
Scrapping main home relief: At the moment you pay no CGT on the gains you make on your main home – in part this is offset by the fact that you have to pay stamp duty tax when you buy a new home.
However, one suggestion has been that the Government could remove or limit this relief. This would mean lots of people who had made a gain on their property would face a large tax bill, but in turn could raise a lot of money for the Government. It would be an odd move to make just as the Government has put in other measures to try to get the housing market moving.
HOW CAN YOU BEAT THE HIKE?
If you’re worried about any rise in the tax rates or cuts to allowances, you could think about locking in gains now. Remember, anything in an ISA or SIPP is exempt from CGT, so you don’t need to worry about those gains. But outside of these tax wrappers your investments could face CGT.
You can choose to cash in gains up to your annual allowance this year, in order to lock in some gains and make use of that allowance. If your gains are higher than your allowance, you could transfer assets to your spouse so they can use their allowance.
Transfers to spouses are exempt from CGT, but if they then sell the assets they’ll face CGT on any profit between the price you bought the investment and the price at which they are selling. If you transfer assets to them, they can then cash in the gains and use their annual allowance to avoid a large tax bill.
For example, let’s assume Mrs Smith has investments that have a £25,000 gain on them, and she is a higher-rate taxpayer. If she sold those investments in one tax year, she’d use her £12,300 allowance but still pay tax at 20% on the remaining £12,700 gain – which would equal a £2,540 tax bill.
However, if she transferred the investments with the remaining £12,700 gain on them to her husband, who is a basic-rate taxpayer, he could use his £12,300 tax free allowance – leaving just £400 of gains to pay tax on. At his lower 10% CGT rate this would mean a tax bill of just £40 – saving £2,500.
Another option is cashing in the gain and rebuying the asset in your ISA, assuming you have some of your annual ISA allowance remaining. This is called ‘bed and ISA’ and means you can use your annual allowance, keep hold of the investment and future gains will be exempt from CGT.
HOW DOES CAPITAL GAINS TAX WORK?
You pay capital gains tax on any profit you make when you sell an asset that has risen in value.
Some assets are tax free, including your main home. Everyone gets a tax-free allowance each year, which is currently £12,300 per person.
Beyond this level any gains are taxed depending on your income tax rate, so basic-rate taxpayers pay 10% (or 18% on property) while higher and additional-rate payers pay 20% (or 28% on property).
If you give money to your spouse you don’t have to pay CGT, nor on assets including land, property or shares you gift to charity. If you make a loss on an asset you can offset that against any gains you make on other assets in order to reduce your tax bill – and you can carry forward losses into future years.
A useful article covering the potential changes to capital gains tax and a breakdown of how capital gains tax works. The Government has spent a large amount of money on helping the country during the Coronavirus Pandemic and it will be interesting to see how the Government plans to pay for this support and what changes will be made.
Please continue to check back for our latest blog posts and updates.
Please see below an investment market update article published by Brewin Dolphin on 21/07/2020 and received yesterday:
Global markets rise on vaccine hopes
Global share markets largely rose over the past week on encouraging reports of progress with some of the coronavirus vaccines currently in development.
Chinese stocks weakened, however, after a period of very strong performance, although we see this as a switch to a more gradual rate of increase rather than an outright reversal of fortunes.
Bond prices rose, perhaps because investors are still nervous that the withdrawal of fiscal stimulus will cause economic conditions to worsen in the future, but economic data was broadly positive over the past week, especially in the US and China.
Last week’s markets performance*
FTSE100: 3.2%
Dow Jones: 2.3%
S&P500: 1.24%
Dax: 2%
Nikkei: 1.9%
Hang Seng: -2.5%
Shanghai Composite: -5%
*Data for the week up to close of business on Friday 17 July.
A bright start to the week
Markets were up in the US and across Europe yesterday as the marathon summit to decide on the €750bn European Recovery Fund showed signs of progress. UK shares lagged, however, with the FTSE100 closing down by 0.49%. The EU summit eventually concluded with a deal in the early hours of Tuesday morning, helping push markets up yet again. UK and European shares were heading up in early trading.
Earnings season kicks off in US
Last week saw US earnings season get under way and the biggest US banks (JP Morgan, Goldman Sachs, Citibank, Bank of America and Wells Fargo) put aside $35bn in loan-loss provisions which weighed on their reported earnings. However, it is important to remember that these numbers are just estimates.
Overall, the earnings season is going reasonably well. According to headline statistics, 52 companies beat earnings estimates compared with 13 who fell short, giving a “beats to misses” ratio of 80%. We don’t find much value in this number as, come good times or bad, the beats-to-misses ratio for earnings is invariably around 80%, with estimates seemingly massaged up and down between reporting periods to create a somewhat artificial optimism.
Generally, though, earnings reports have been reasonably well-received by the market and this is better news – it implies that guidance, to the extent that companies have been able to offer any, has been well received.
One exception would be Netflix, whose subscriber growth numbers disappointed the market despite management warning that the pace of growth would slow. Shares dipped 15% in after-market trading.
Upbeat Main Street
Last week saw consensus-busting US retail sales figures, with sales up 7.5% in June following a record 18.2% increase in May.
Source: Datastream / US Census Bureau July 2020
That came on top of an encouraging manufacturing purchasing managers’ indices in Philadelphia and New York which, taken together, would suggest activity has stopped contracting and is now expanding at a healthy rate.
The Federal Reserve Beige Book, a survey of the 12 US regional Federal Reserve districts, was also positive, showing economic activity increased in almost all jurisdictions and consumer spending picked up as many nonessential businesses were allowed to reopen.
Industrial production rose 5% in June, business inventories fell 2.3% and home-builders’ confidence for this month returned to the March’s pre-lockdown level.
Things were a bit more mixed in the UK. The May GDP figure was disappointing for the market and there was very little comfort taken in the unemployment rate remaining low, given it is likely to increase as state support is withdrawn. However, UK retail sales jumped by 3.4% in June, up from a 5.9% fall in May.
China’s trade was better than expected. Forecasters expected to see a 9% decline in imports, but actually got a 3% increase, reflecting stronger local demand.
Stimulus news
In the US, the unemployed are set to lose their $600-a-week in extra unemployment benefits on 31 July. If this cut goes ahead the strong retail sales numbers will deteriorate very quickly, and so we expect them to be extended, especially given it is an election year.
In Europe, the €750bn European Recovery Fund was approved early on Tuesday after one of the longest meetings in EU history. The agreed package includes €390bn of grants to countries most in need, and €360bn of low-interest loans. The package of grants was pared back from an initial proposal of €500bn, due to opposition from the so-called Frugal Four (Austria, Denmark, Netherlands and Sweden). In return, those countries will now receive bigger annual rebates from the EU.
West vs East
The big news in the escalating tensions between the US and China was President Trump ending Hong Kong’s special status with US. The implications of the move are still to be determined but ought to mean the loss of preferential trade arrangements. That will have limited implications for the US, but will be very harmful for Hong Kong’s domestic economy.
In response China summoned the US ambassador and said it will sanction US officials, while the US said it will sanction people and entities that it thinks are undermining Hong Kong’s freedoms. This is a fast-moving situation and further developments are expected this week.
COVID vs humanity
More bad news for Hong Kong is the outbreak in coronavirus cases that may actually exceed those experienced during the first wave of the crisis. It is worth remembering, however, that the city weathered the initial wave relatively well. The most economically significant growth in cases remains in the US. Looking for positives, the rate of growth looks to have peaked, giving hope that the actual numbers may slow this week or next. There have also been fewer hospitalisations, which seem to have peaked along with deaths. Normally these metrics would lag behind case growth, but it appears that voluntary social distancing by “at-risk” groups may have flattened the curves for these most dire metrics.
Please continue to check our Blog content for advice and planning issues and the latest investment, markets and economic updates from leading investment houses.
Please see article below from Jupiter Asset Management written by the European team at Jupiter – received 21/07/2020
Summary
Welcome to the second instalment of our quarterly series of investment updates from your European Growth team at Jupiter.
Alongside our usual monthly fund commentaries, we aim to build a library of insights into the way we think and the way we work. Think of this as the behind-the-scenes extra to the main feature.
This quarter we give an update on the team, consider the global reach of our investments and offer an alternative perspective on the value of dividends.
Team update
We are very pleased to announce two new hires to support the European Growth strategy. We look forward to welcoming Nikisha and Phil and hope to introduce them to you in person when conditions permit.
The first, Nikisha Mistry, has joined us from Merian where she has worked on the European Smaller Companies strategy for the past three years. Nikisha will begin by focusing on ideas and holdings in our Smaller Companies funds but over time will, like all of us, broaden her coverage to the entire European investment universe.
Phil Macartney is an experienced equity investor we know well and are excited to have joining us. Phil is a UK and European analyst having worked on both long and long/short funds over 13 years. He joins us from Columbia Threadneedle where he was co-manager on the Threadneedle UK Mid-250 fund and also deputy manager on the Threadneedle UK Absolute Alpha fund. Phil joins the team in September.
Our culture of challenge and constructive debate will only be enhanced by these two excellent hires.
Around the world in 80 days
In lockdown for 80 days or so and unable to follow in Phileas Fogg’s footsteps, we have had time to consider the global nature of our strategy. Our search for companies with sustainable advantages naturally leads us to businesses that compete on the world stage.
As European equity investors, we regularly meet many who bemoan Europe’s prospects. They cite demographic headwinds and bureaucratic, inefficient governments. Some are hampered by large debts while others with strong fiscal positions are reluctant to spend.
We see things differently. Whether it is the digitalisation of the financial system in Brazil, the dynamism of healthcare in the United States or the emerging middle class of consumers in China, European-listed companies offer us access to many attractive growth opportunities. And, being European, they often come with better corporate governance, accountability and a focus on sustainability, too.
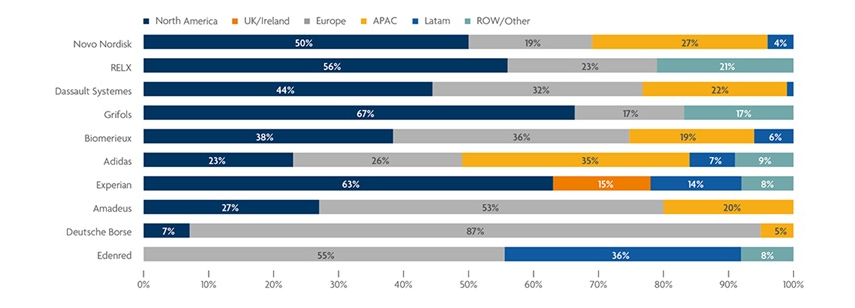
Revenue by Geography FY19
Chart: Company revenues by geography full year 2019 for some of our largest holdings. (Source: Jupiter, Bloomberg)
Global healthcare
Although the USA is known for innovative biotechnology, it is not alone. Europe was a pioneer in the process of plasma exchange – the harvesting of antibodies from blood donors to make therapeutic agents used to treat many autoimmune conditions. The pioneers, Dr Grifols and his two sons, built up the eponymous company in which we invest – it is still run by members of the family today and generates over two-thirds of its profits from the US market. Grifols continues to innovate. One potential area of promise is Alzheimer’s disease, where research has shown its products slow the progression of the disease in some patients with moderate Alzheimer’s.
Accessing Chinese consumers
A family feud between the Dassler brothers resulted in the creation of Puma and Adidas. Today, both would agree on the importance of China to the sporting goods industry. Last year, Adidas generated 35% of its revenues in the Asia-Pacific region with China being the largest contributor. A favoured brand among some 400m Chinese millennials, Adidas has stores in over 1,200 cities in China but hopes to expand to 2,400 to meet the growing demand. A strong digital footprint allows it to serve customers through its own website and those of partners such as Tmall.
Formalising the Brazilian economy
Edenred, a French company originally spun out of Accor, delivers digital payment solutions that appeal to clients far beyond its traditional homeland. Its products efficiently deliver benefits to corporate employees, give companies greater control over their expenses and help governments formalise their economies. In 2009, Latin America alone accounted for 40% of total operating profits. Here, over 90% of its business is digitalised compared to two-thirds in Europe. Digitalisation allows Edenred to offer many different benefits to its customers in a highly-attractive and cost-effective manner.
Global leadership in niche markets
Global leadership is not the preserve of large companies. Smaller companies often dominate their markets, especially in niche areas. For example, Dometic, with a market cap of just Eur2.3bn, is the leading manufacturer of appliances and components for recreational vehicles. It enjoys a market share of 45%, some four times greater than its nearest rival. Dometic’s headquarters may be in Sweden but over half of sales arise from the Americas, its largest market.
A preference for effective capital allocation – why we don’t focus on dividend yield
Companies are increasingly asking us what we think about their dividend policies. You can probably guess why.
It’s been an extraordinary year. For equity investors, huge uncertainty and immense share price volatility have made many traditional valuation metrics meaningless. Income investors have had a torrid time as supposedly stalwart dividend payers cancelled or clawed back payments to offset collapsing revenues, bolster over-stretched balance sheets or assuage societal scrutiny.
When Royal Dutch Shell surprised the market in late April, cutting its dividend for the first time since the Second World War, parts of the financial press went into overdrive.
“…investors who have diligently saved for retirement and rely on shares that pay regular dividends, now face a shortfall in their annual income” (This is Money – 31 March 2020)
This kind of sensational hyperbole misses the point. The real issue is that such dividend cuts are likely symptomatic of a material reduction in the intrinsic value of the company.
A common misunderstanding
Even though dividends are decided annually by the board, some investors use the dividend yield to determine the attractiveness of a company. However, we believe this is a poor guide to the intrinsic value of a business and can lead to poor corporate capital allocation.
Nevertheless, dividends are considered, by many, as a significant part of how a company creates value for its shareholders. Consequently, some management teams slavishly try to meet specific dividend expectations or consistently grow the annual dividend per share. But is this really the best use of investors’ hard-earned savings? Do they really care how their investments are liquidated. And, more importantly, should they care?
Given that investors can create their own dividends by liquidating a portion of their holdings, we argue that the rational investor should not care1. That’s because dividends are not free income, they come at the expense of capital. If you receive a 5 cent dividend on a Eur1 share, the share price will drop in value to 95 cents. It is, in effect, an enforced capital release, not a creation of value. In our view, it makes more sense for the investor or portfolio manager to decide what capital to release and from which underlying assets, not a company management ignorant of the requirements of its individual shareholders.
If the right opportunities exist – reinvest
It is our firm belief that company managements should focus on whatever will create the greatest risk-adjusted total return for their shareholders. Thus, we would much rather a management reinvested excess cash flow into projects and opportunities with an attractive internal rate of return than feel obliged to return it to shareholders. The opportunity cost of cash returns (dividends and share buy backs) can be substantial. Reinvesting excess capital at high rates of return within the business will enable shareholders to harvest a much greater income over time, than if a company simply returned all excess income annually.
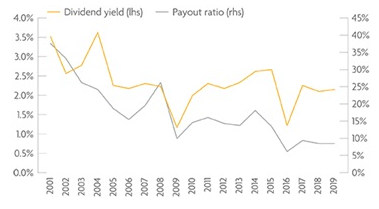
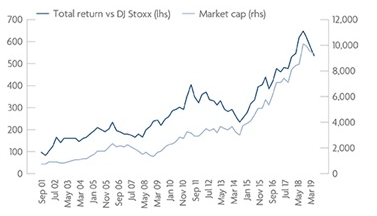
Campari, the drinks manufacturer, provides an example of how thoughtful capital allocation creates value for long term shareholders. Campari’s management is perhaps less constrained than many. With just one key majority shareholder, it is supported in its longer-term growth ambitions. And although Campari does pay a dividend, it is essentially an afterthought. What matters to management is the long-term creation of value. Here, Campari’s strategy is to acquire local or regional brands and then develop their appeal to a broader market. Its brands include Aperol, Grand Marnier and, of course, that great bitter, Campari. By using its excess capital to acquire niche spirits brands, Campari has moved from being a relatively small player to a key competitor in the global spirits market. Had management instead focused on maintaining a 40%-50% pay-out ratio then the investment story would have likely been quite different.
Campari – capital allocation decision to reduce dividend pay-out ratio (rhs %)
Campari – Relative share price performance and Market Capitalisation (Eur m)
Charts: Campari chose to reduce its dividend pay-out ratio and use its free cash flow to focus on long-term value-enhancing M&A. This has created huge capital appreciation for shareholders in absolute terms and also relative to the wider market. (Source: Jupiter, Bloomberg)
That is not to say that companies should not pay dividends. If there is no opportunity to enhance shareholder returns through further investments then excess cash should be returned.
Your Jupiter European Growth team: Mark Nichols, Mark Heslop, Sohil Chotai, Nikisha Mistry
An interesting article from the European team at Jupiter Asset Management which gives us a good alternative perspective on the value of dividends and the global reach of their investments.
Please continue to check back for our latest blog posts and updates.
Please see below an article published today by A.J. Bell providing clarification on the transaction costs (expenses) incurred by fund managers when dealing with investments.
The MiFID II and PRIIPS regulations have been in force for some time now, having come into effect in January 2018. A key part of these rules relates to transparency in costs and charges disclosure, and a particular requirement of this was for asset management firms to disclose transaction costs.
The additional disclosure is designed to help investors make informed choices, but the presentation and comparison of transaction costs continue to cause some confusion even two years on. In this article, we will look at an overview of how these costs are calculated and what they mean for fund investors.
What are transaction costs?
Transaction costs represent the expenses of dealing in the underlying investments in a fund’s portfolio. These costs have, of course, always been present prior to MiFID II and PRIIPs, so they are not ‘hidden charges’ per se, but they do have an effect on an investor’s overall returns and therefore the regulations now mandate that firms should provide a clear disclosure of them to investors so that they can assess the total cost of ownership for products.
Transaction costs for funds are made up of three parts:
explicit costs;
implicit costs; and
anti-dilution benefits.
In a simple form, the costs disclosed to investors can be calculated as follows:
These are the ‘direct’ charges incurred when a fund manager purchases or sells the underlying instruments in their funds. Typically, these are things such as commissions paid to brokers and taxes such as Stamp Duty.
Implicit costs
As their name suggests, implicit costs are not directly incurred by the fund manager. Rather, they represent the difference between the price of a security (mid-price) immediately before an order is placed in the market (this is sometimes called the ‘arrival price’), and the price that the trade is actually executed at. This difference is sometimes called ‘slippage’. Due to market movements, implicit costs can be positive or negative.
Anti-dilution benefits
Large investor subscriptions or redemptions often mean that a fund manager is required to trade in the underlying portfolio, and the costs of this are borne by all investors in the fund rather than just the investors who have caused the trading. To combat this, many funds use an anti-dilution mechanism to dampen the effects of large investor subscriptions and redemptions.
For example, swing pricing, dual pricing or a fixed-dilution levy may be used to cover the costs of dealing from new transactions. The MiFID II and PRIIPS rules allow these anti-dilution benefits to be subtracted from overall transaction costs – but only up to the amount of dilution actually caused by trading. Fund managers using an anti-dilution mechanism may therefore disclose relatively low transaction costs.
Example calculation
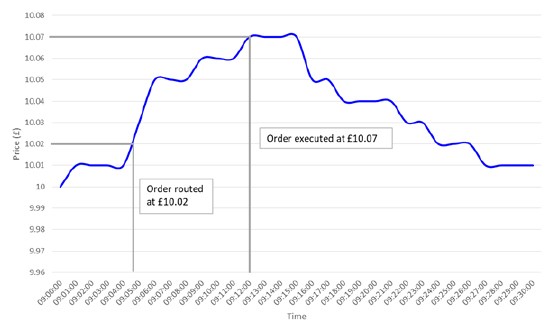
To show how transaction costs are calculated, let’s look at a theoretical example. In this example, a fund manager is purchasing 10,000 units of a security from a broker which charges a commission of 3%. The purchase is routed to the broker just before 9.05am and, at that time, the mid-price is £10.02. The price of the security is steadily rising, and when the broker executes the order at 9.12am, the mid-price is £10.07. This is shown in the graph that follows.
What transaction costs have been incurred here?
The explicit cost is the broker’s commission: 10,000 x £10.07 x 3% = £3,021 The implicit cost is due to the market movements: 10,000 x (£10.07 – £10.02) = £500
So, total transaction costs here are £3,521.
Our scenario showed the price for a purchase where the market was rising. If the price had fallen, then the implicit transaction cost would actually have been negative. This works the opposite way for sales – rising markets result in negative costs and falling markets show positive costs.
Transaction costs as a comparative tool
The level of transaction costs can be a measure of the execution quality obtained by a fund manager. Used in the right way, they can be a good comparison when analysing the value of different fund choices, which was the intention behind the MiFID II and PRIIPs regulations. Transparency has certainly been increased across the board, with some asset managers choosing to go further than regulations strictly dictate and disclosing transaction costs not just in funds, but also in model portfolios, for example.
However, whilst it would be tempting to think that ‘smaller is better’, when comparing fund transaction costs you have to make sure that you are not comparing apples with oranges.
There are many factors that might affect transaction costs, and in particular the strategy and objectives of the fund should be borne in mind.
Funds dealing in less liquid securities will generally have higher transaction costs than those dealing in more liquid securities. More liquid securities are typically executed much more quickly than less liquid securities, hence the gap between the arrival and execution price is smaller.
Funds with a high turnover will tend to show a higher level of transaction costs – so, actively-managed funds, which typically transact more often than passive funds, will tend to have higher transaction costs for this reason.
Some funds may disclose negative transaction costs – this could be due to their investment and trading style, or could be due to incorrect application of the rules – something that the FCA has noted and investigated.
Also, although we haven’t gone into the technical details in this article, there are some slightly different calculation methods for implicit costs, such as a different method for new (under three-years-old) funds, which can produce subtly different results.
Summary
Disclosure of transaction costs has provided another way for investors to compare funds. Although it can be a fairly complicated area, it pays to do your research beyond the headline numbers – as we have seen, there are some nuances to be aware of when reviewing these costs.
Finally, it is important to note that net performance includes all of the costs discussed in this article and so, as well as looking at the total costs of a fund, analysis of net performance remains a robust way of assessment between different products.
Please continue to check our Blog content for advice and planning issues and the latest investment, markets and economic updates from leading investment houses.
Please see the article below published by A.J. Bell last week (14/07/2020) and received yesterday, which provides an update on the status of the M&G Property Portfolio fund:
Investors in the M&G Property Portfolio will have to wait at least another month before they can get their hands on their money, with the fund’s suspension extended for another 28 days. Investors have endured more than seven months of suspension so far and it now feels likely that the extension could continue until the end of the year.
This update provides a small glimmer of hope, as the independent valuers on the fund say they have clarity over pricing in another two areas of the property market: central London offices and student accommodation. Along with industrial and logistics properties, this means that they can accurately price 28% of the fund. However, that means more than 70% of the fund is still invested in assets where there is no certainty over their value – the fund has a long way to go before it gets below the FCA’s 20% threshold for uncertainty over valuations.
The majority of property fund investors are doing so partly for the income they’ll receive, but this has been very uncertain during the Covid-19 crisis, with many companies unable to pay rent or deferring it. The managers on the M&G fund say they are now getting 71% of their rent due, slightly up from two-thirds in April, meaning investors should expect a similar 30% haircut to their income payouts from the fund.
The M&G property fund is fighting fires on two sides before it can re-open: one on the accurate valuation of its assets and another on the level of liquidity in the fund. Investors will be disappointed that no properties have been offloaded since last month’s update and there are still £180m of assets either under offer or exchanged on. Considering over the past seven months of the fund closure there has been almost £150m of assets sold, there could be a long road to go before there is sufficient cash to re-open.
As you can see from the above, there is still a fair bit of uncertainty surrounding the M&G fund in terms of re-opening and its peers will be facing similar challenges.
Commercial Property investment still has a vital role to play in portfolios, as it remains a great investment diversifier.
It is important to remain patient and focus on your long-term investment goals.
Please continue to check our Blog content for the latest investment, markets and economic updates from leading investment houses.
This is the final instalment into our 3-part introduction to ESG.
Recap
In part 1, we explained what ESG is. In part 2, we went a little deeper and looked at the 10 ‘UN Global Compact Principles’ and the screening process for firms when selecting ESG compatible investments and companies.
Please check out the first 2 instalments if you haven’t already.
Here in part 3, the final instalment in our ‘What is ESG? – An Introduction’ blog series, we will look at what we at People and Business are doing as a firm to make sure that we are moving in the right direction by selecting firms with good ESG processes.
Due Diligence
We are required to write an annual Due Diligence report as a firm, to demonstrate our processes into making sure all the firms we use, whether it be a platform, product provider or investment solutions, are and remain suitable for our clients.
We measure this in a number of ways including service levels, performance and now, their ESG processes.
Whilst this is an annual requirement, we don’t view this as a once a year ‘tick box’ exercise. Our Due Diligence process is built into everything that we do. We continuously look at the companies we partner with, to ensure they provide the best possible service for our clients. The annual report is just a summary of our findings over the past year.
As our Due Diligence is something we build into our way of working on an ongoing basis and our ESG research is ongoing, this will be added as a permanent section of our annual Due Diligence report which we complete in the last quarter of each year. This month, we wrote an addendum to this report, fully focused on ESG.
Our ESG Focus
Last year, when the ESG investment focus really started getting some momentum, we made the decision to build this into our Due Diligence process and move towards an ESG investment approach where possible, and suitable for our clients.
We have asked our clients (both new clients and as part of our annual review process) for their thoughts on ‘ethical’ investing for years. Traditionally, ‘ethical’ investments haven’t produced the same level of returns as standard investments, but this has been changing. You no longer need to compromise on your investment returns to be a ‘good’ investor.
Just over 2 years ago, we became aware that Blackfinch Asset Management were due to launch a series of ESG approved Managed Portfolio funds. However, with any brand new investment, it’s not practical to go jumping in straight away. We need to see past performance over a real measurable period and how firm’s manage their investments and keep us, as the IFA, updated into the management of their Model Portfolio Services.
We were impressed with what we saw from Blackfinch and their ESG screening process. They use a combination of positive and negative screening, with much more of a focus on positive screening.
Over the past 2 years, we have been monitoring the progress of these portfolios and how they manage them. In September 2019, Steve actually went and visited Blackfinch’s Head Office, meeting key investment personnel and fund managers in Gloucester.
On the 2 year anniversary of the funds, we undertook analysis on the Blackfinch portfolios against their peers in the market which we currently use or have recommended in the past, and not only found they out performed, but had the strongest ESG processes.
Given our research, we have made the decision to introduce these Blackfinch Managed Portfolio Solutions into our investment proposition, where appropriate for our clients.
We are satisfied that they are ahead of the game on their ESG policies and feel that they will only continue to enhance these.
Currently, we are still under way with our ESG project and are looking into the ESG policies of all the investment firms/ solutions we have under our proposition and will continue this throughout the rest of this year, and then monitor this on an ongoing basis.
We are now building ESG into our client review process, highlighting ESG to our clients and getting their views.
Although ESG is still a relatively new concept within the industry, we have been looking at this for a while behind the scenes and will continue to embed this focus through everything we do at People and Business. As the market becomes more ‘ESG aware’ we expect there to be much more of a focus on ESG in this industry and we will monitor this to ensure that we keep up to speed.
Summary
Hopefully this blog series has given you a brief understanding of what ESG is, how this is measured and what we are doing as a firm to ensure we are moving towards more sustainable and socially responsibly investments.
This may be the final instalment into this ‘What is ESG? – An Introduction’ blog series, but this won’t be the last you will hear from us on the subject of ESG (far from it!).
As this blog notes, this is becoming a big theme in this industry, and we want to make sure we are and continue to be ahead of the curve, by selecting investments and firms that, we believe are ‘doing the right thing’.
The current Covid-19 Pandemic has further raised the profile of ESG as people contemplate potentially the next major crisis, global warming.
Along with our regular industry updates, we will continue to source good ESG content to keep you updated, and later this year, we will post an update into how we are getting along with our ESG processes.
As a business, we will also consider how we can move in the right direction too. We are about to invest in new lights in the office that use far less power.
Please see article below from Close Brothers Asset Management received 17/07/2020.
Looking at the path to recovery
SUMMARY
•Covid-19 has already dented global growth in 2020 • Having fallen initially, equity markets have recovered as investors take a long term view • Sovereign bond yields remain at or near historic lows across most developed markets • The efficacy of health policy will be key in determining how long the pandemic lasts – the effects of the pandemic on the economy are likely to be long lasting • The global economy may be less interconnected in years to come, due to changing supply chains, a larger role for fiscal and health policy and geopolitical tensions • Changes already underway have been accelerated by the pandemic – investors must identify the winners and losers in the post-pandemic world
INTRODUCTION
In the first quarter of 2020, the spread of Covid-19 around the world precipitated an unprecedented health emergency, forcing countries worldwide to respond quickly with dramatic measures to limit the spread of the virus. Stock markets initially plunged, as investors reacted to this sudden new threat to the global economy, while bond yields reached new lows, reflecting investor caution and the expectation of central bank monetary stimulus. At one point, the price of a barrel of oil turned negative, as low demand and a supply glut exhausted North American storage capacity. The world had seemingly been turned on its head in a matter of weeks.
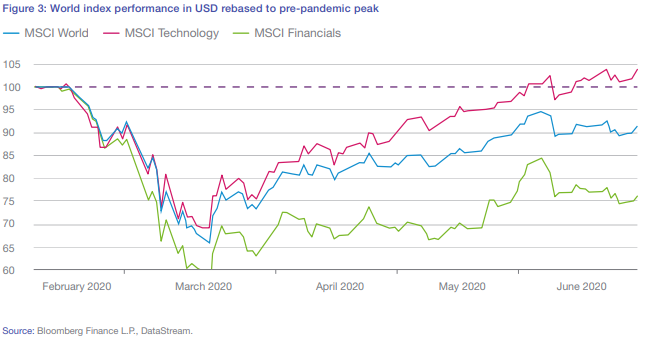
In time, markets have recovered much ground, comforted by both governments and central banks stepping in to ease the immediate impact of the pandemic on consumers and businesses. The MSCI World Index, having fallen over 30% in February and March, was less than 10% below the pre-pandemic level at the end of June. Given the backdrop of an immediate global recession, and an uncertain path to recovery in 2021, such strong performance is hard to reconcile. Within bond markets, sovereign yields remain anchored, with the yield on a 10Y US treasury still well below 1%, suggesting a more pessimistic view of growth.
While investors have learned to stomach the immediate economic implications of Covid-19, what lies ahead is still somewhat unclear. Nonetheless, even in a time of such uncertainty, there are some conclusions investors could draw with a degree of confidence, many of which have clear and important implications for businesses.
LASTING SIDE-EFFECTS
The disruption caused by the pandemic may be with us for some time. The pandemic is not yet over. While the initial surge of the pandemic is behind us here in the UK and restrictions are easing, in parts of the US, Russia, India, Latin America and Africa, the spread of the virus is still accelerating (see figure 1). What is more, there are some signs of a “second wave” of the virus in some countries that have eased restrictions, resulting in social distancing being reintroduced.
Epidemiologists and health professions in general know much more about Covid-19 than they did at the start of 2020, but much is still unknown. Research into the virus is focussed on three key areas which will determine how long the pandemic lasts.
1. VACCINE The first focus for research is to find an effective vaccine – until an effective vaccine is found, Covid-19 will remain a health risk. The global health community has already started a coordinated research effort, with a number of potential avenues being explored. There are also funding programmes and agreements in place designed to ensure that access to a vaccine is fair, so as to avoid poorer countries being deprived of important health resources. However, developing, testing and distributing a vaccine will take time. Unlike medication that is given to those who are ill, a vaccine is given to someone who is well. An effective vaccine also needs to protect a person for a reasonably long time, not just a few weeks. All of this means that vaccine testing takes longer than other kinds of medication. With these facts in mind, and despite all the resources being committed, it is unlikely that a vaccine will be available in 2020.
2. TREATMENT A second area of research is that into treatments for people already suffering with Covid-19 symptoms. These treatments either seek to limit the virus’ ability to attack the body, or to limit the complications caused by the body’s own response to the virus. Such therapies may limit the severity of the illness the virus causes, saving lives and reducing strain on health services. So far, only limited progress has been made in this research area, mostly in terms of repurposing existing drugs that have been found to have some positive impact on Covid-19 patients. This means that, for now at least, the disease caused by the virus remains a serious concern.
3. TRANSMISSION The third research area is concerned with the transmission of the virus. What factors determine how easily the virus is spread? Which social distancing measures are most important in order to limit contagion?
How do we know who has the virus? While our understanding of how the virus spreads is improving, research in the area remains nascent. For now, policy makers have limited access to data assessing the effectiveness of various social distancing measures, though over time this will improve. As a result of this, it is possible that governments will have to test different policy measures before they are able to establish which are most effective. On the virus detection front, scientists are making some progress towards quicker and more accurate tests for the virus, which may help policy makers control the spread.
Given that a vaccine is unlikely to be available in 2020, the limited progress made in finding a therapy, and the limited data available to policy makers when evaluating social distancing programmes, it seems likely that the economic disruption caused by the pandemic will be long-lasting.
DESYNCHRONISATION IS COMING
The global economy may become less coordinated as a result of thepandemic The prevailing trend of the global economy over the last two decades has been one of globalisation – increasingly sophisticated and interconnected supply chains have allowed businesses to source materials and labour worldwide, and just-in-time production technology has eliminated the requirement for businesses to hold a large inventory. As a result of this, the global economy also became increasingly synchronised – monetary stimulus in China would ripple across the globe, impacting copper prices in Chile and hotel rates in Cherbourg.
The pandemic may cause a partial desynchronisation in the global economy for a number of reasons. Firstly, the experience of the pandemic has revealed the importance of supply chains being not only efficient, but also resilient. For strategically important goods, this is likely to lead to a partial re-shoring of production, reducing the supply chain’s vulnerability to shocks along the line. For other goods, it seems possible that nations may also shift some off-shore production from distant manufacturing hubs to a neighbouring country with appropriate manufacturing capacity. While this does not signal the end of globalisation, we may see some fragmentation in global trade and a period of disruption while supply chains are re-orientated.
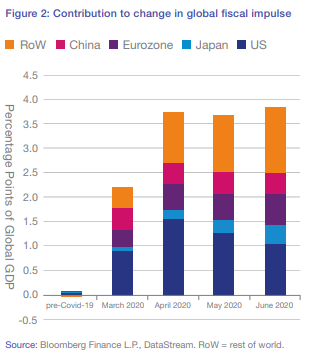
The second driver of desynchronisation is the greater importance of health and fiscal policies versus monetary policies. In the years since the financial crisis, monetary policy has been the dominant policy tool used to control the global economy, with governments in the world’s developed markets unenthusiastic, for the most part, about accommodative fiscal policy in the wake of a crisis. While monetary policy remains an important and powerful policy tool with a strong influence over the global economy, attitudes to fiscal policy have changed and government spending is likely to be higher in those economies that can afford it and those prepared to borrow further to fund it. While monetary policy has mostly washed through the global economy, especially that enacted by the US and China, the effect of fiscal policies may be more localised and heterogeneous, as the results will depend on the efficacy of the measures introduced, the scale of spending, and the sphere of focus (see figure 2 below).
Lastly, the stresses caused by the pandemic appear to have further stroked nationalist feeling in some of the world’s economies, exacerbating geopolitical tensions that were already simmering away. We see this especially in global relations with China, where tensions are rising on a number of fronts.
While we do not expect the age of globalisation to end altogether, it does seem possible that desynchronisation may cause greater dispersion in asset performance across geographical regions.
ACCELERATED CHANGE
The pandemic has accelerated a number of structural changes that were already in train. In the words of Vladimir Lenin, “There are decades where nothing happens; and there are weeks where decades happen.” For many of us, life has changed a lot since the beginning of the pandemic, in both large ways and small. These changes have knock-on implications for the economy and businesses. One such example of a trend accelerated by the pandemic is the wider adoption of working from home. The pandemic has forced many businesses to adjust working practices and put in place the necessary technology and procedures to allow employees to be as productive from home as they would be in the workplace. This makes remote working for some not only possible, but an attractive option. This is supportive for the industries that facilitate this approach to working. However, it is likely to cause disruption to other sectors of the economy – remote working is likely to weigh on the airline sector, especially those carriers more exposed to business travel, if companies do not adjust. Demand for housing may also change – space for a study may be more important than proximity to a railway line. For those sectors where remote working is not an option, the extra costs associated with providing a virus-safe working environment may shift the scales in favour of the wider adoption of automation.
While few of these trends are new, the pace of adoption appears to have been spurred by Covid-19. Businesses themselves may also be transformed for better or worse. New business practices may add costs for some companies, but may provide opportunities to increase efficiency for others. Indeed, some listed firms will emerge from the crisis slimmed down and more profitable than when they went in to lockdown.
POSITIONING PORTFOLIOS
Given what we know about the pandemic, what is the likely impact on asset prices? As we have discussed, we expect global growth to be much lower than usual this year, and this in turn will weigh on corporate earnings growth – with some companies already cutting dividend payments (earnings paid out to investors). Given the pace of research progress into a vaccine, treatments and limiting transmission, some of the effects of the pandemic will be long lasting, making it likely that the economic recovery takes longer.
While growth may be depressed near term, shares are long term investments and current prices should theoretically reflect the present value of all future earnings, not just those in the next twelve months. On this basis, it is the structural changes accelerated by the pandemic that will likely have a more meaningful impact on asset prices. Asset prices certainly reflect this in some areas, with the global technology index outpacing the broader global index, and currently sitting above pre-pandemic levels (see figure 3 below).
In this environment, we believe that active management will be even more important. Investors must consider which health and fiscal policies are likely to be more favourable, and as a result, which regions will experience better outcomes. We must also consider which industries are best positioned and which businesses are best adapting to the realities of the post-pandemic world.
Within the bond market, the new outlook for global growth makes it likely that interest rates will remain at new lows for longer, which is generally supportive for bonds. However, the marked increase in government bond issuance is a potential source of concern. While central banks have committed to bond buying programmes, this appetite may not be unlimited. With government bond yields so low, further monetary accommodation may be required in order to eke out further price performance from these richly priced assets. Nonetheless, given the scope for shocks to the economy, bonds play an important role within multi-asset portfolios.
Across shares and corporate bonds, our research focus remains on businesses with ample working capital, as it is these businesses which we believe will be able to survive and thrive once immediate emergency support measures are withdrawn. At some point, social distancing measures will be lifted and growth will recover. Our priority now is establishing the right price for assets that will survive the here and now and will be attractive to hold in the longer term.
CONCLUSION
With the initial turmoil of this unprecedented health and economic emergency behind us, we are focussing on the longer term implications of Covid-19. We continue to closely monitor the evolution of the health data in order to better gauge the likely duration of this period of weak growth, and to analyse individual securities so that we may identify those with the greatest near term resilience and long term prospects.
A good insight from Close Brothers Asset Management.
The disruption cause by COVID-19 could be with us for some time yet. Whilst the initial surge of the pandemic is behind us here in the UK and some restrictions are easing, in parts of the US, Russia, India, Latin American and Africa, the spread of the virus is still accelerating with some signs of a ‘second wave’ of the virus in some of the countries that have eased restrictions. What lies ahead still remains somewhat unclear.
Please keep checking back for regular updates and blog posts.
Please see below that latest articles published by Jupiter Asset Managers yesterday (15/07/2020):
UK recovery pushed further out as GDP growth disappoints
Philosophically, Dan Nickols, Head of Strategy, UK Small & Mid Cap and his team are investors who are happy to range across the Value/Growth spectrum depending on where they can find the most appealing opportunities at a given point in time. In the UK small and mid-cap universe, as elsewhere, Growth has trumped Value for a number of years. The most expensive quintile in the universe trades on about 39x forward P/E, but if you remove the outliers from either end and compared the 30th percentile against the 70th percentile in terms of valuations, the gap there is widening too. This is the most polarised market from a valuation perspective that Dan can remember over his c.20-year career.
It is easy to rationalise why the market is behaving this way, said Dan, with so much uncertainty due to Covid-19 as well as the ongoing geopolitical issues at present. In that environment, with interest rates even lower for even longer, it is understandable that so many investors favour the relative ‘certainty’ of earnings provided by the growth dynamic notwithstanding elevated valuations. UK GDP growth in May was only 1.8% compared to the consensus expectation of 5%, meaning that the recovery feels like it is getting pushed further out. Nevertheless, looking forward it feels to Dan like the cheaper, more economically sensitive parts of the market, have more to gain from economic normalisation – providing, crucially, that one can find stocks that are not structurally challenged.
Everyone is in a holding pattern, for now, said Dan, while we wait to see what path the virus will take over the coming months and into next year. Have governments and central banks done enough to put economies into cold storage so they can be thawed out and resume growth, or will there be widespread balance sheet disruption that will take longer from which to recover? Only time will tell, but some visibility around these issues is what the cheaper parts of the market need to outperform, in Dan’s view. In the meantime, Dan and his team continue to prefer structural growth stocks, but are very conscious to have complementary exposure to well-run, conservatively-financed cyclical stocks that they believe can re-rate when conditions to normalise.
Is China’s domestic market overheating?
The biggest standout in a sea of red for global equity indices this year is the NASDAQ, which is up about 16%. However, there has, said Ross Teverson, Head of Strategy, Emerging Market, been a similar move in the CSI 300 Index, which consists of the 300 largest domestic A-share companies listed in Shanghai and Shenzhen. Meanwhile, other major emerging markets like Russia, Brazil, India and Mexico are down anywhere from 13% to 34%.
If you look within China, that gain in the CSI 300 Index looks modest to compared to what some other indices have done, for example China’s own equivalent to the NASDAQ is up c.55% YTD. Helping to fuel this rally has been a growing number of retail margin accounts in China.
There are signs, therefore, that the domestic Chinese market is starting to get quite heated. Valuations of Chinese companies with dual listing in Hong Kong began this year on a premium for their domestic listing, and that premium is now even wider.
What has driven this investor optimism? It is certainly true that China has coped relatively well with Covid-19, and there is also a strong narrative about the Chinese government’s support for home grown technology. Ross stressed that we should remember, however, that the Chinese economy has by no means escaped damage from Covid-19. A recent survey found 18% of respondents said their income had fallen by more than 50% during the pandemic, with another 15% saying their income had fallen 25%-50%. As in the West, the full impact of this economic stall has yet to be fully felt.
Ross’s own preference has been to gain exposure to China through Chinese businesses listed in the US, Hong Kong or Taiwan, as often he finds it possible to buy better business on lower valuations that way. Given the strong bull run in China’s domestic market, that clearly has not been the right positioning recently, and Ross won’t try to predict the timing of a correction, but Ross continues to believe that asset price discipline is vital.
What does a 5G world look like?
We don’t yet know exactly what the 5G technological revolution will look like, but it will certainly change how we interact with the world, said Stuart Cox, Fund Manager, Global.
With so many people now working from home, it’s easy to see why very efficient, high performing phones would be in high demand. Theoretically, 5G is dramatically faster than current 4G technology. Initially, coverage may be patchy, of course, until the infrastructure is fully rolled out, but the long-term potential of 5G phones is clear, says Stuart.
With such fast speeds, 5G handsets could render WiFi routers from broadband providers obsolete. We don’t yet know what ‘killer apps’ would replace it – the equivalent to Office 365 kickstarting the cloud revolution – but it’s very likely that 5G phones will become the medium through which we interact with a future 5G world, whether that’s smart cities, autonomous driving, industrial applications, or home offices. It’s a huge opportunity, says Stuart, and one that could unlock a lot of future growth that some of the world’s largest tech companies in particular are well placed to capitalise upon.
Please continue to check our Blog content for the latest investment, markets and economic updates from leading investment houses.
Please see article below from J.P.Morgan’s weekly market update – received 13/07/2020.
The US presidential election will take place on 3 November 2020. The result will have important implications for investors, as the combination of policies employed by the next administration could have a significant influence on whether the US stock market can continue the outperformance that it has recorded for much of the last decade. Our regularly updated election insights provide investors with all they need to know as the election story evolves.
US election insight – July 2020
The race for the White House is heating up. Joe Biden and the Democrats have seen a surge in the polls in recent weeks, as the US experiences a wave of Covid-19 cases and against a backdrop of widespread protest against racial inequality and social justice issues. The Democrats are also making strong headway in the battle for the Senate, increasing the odds of a “blue wave” in November. The next key event will be the selection of Joe Biden’s running mate – a decision that takes on more significance this year than in a normal election campaign.
What will be voted on in November?
The race for the White House is the main focus, but a president’s ability to achieve their policy goals is influenced by who controls Congress.
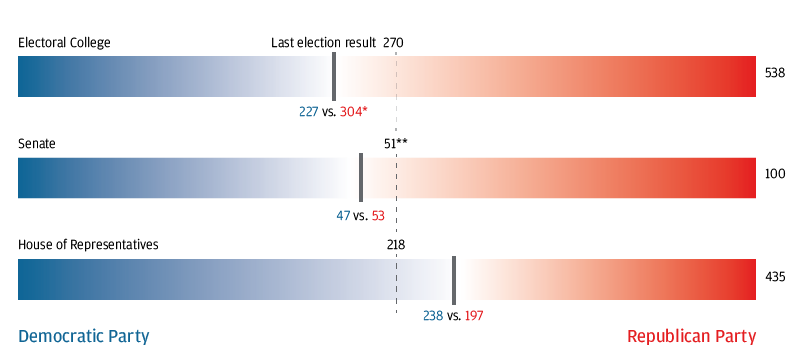
American voters will be asked to make three key decisions on 3 November. The main focus will clearly be on who wins the keys to the White House, but a president’s ability to achieve their policy goals is influenced by which parties control the two arms of Congress: the House of Representatives and the Senate. If Congress remains divided between the Democrats and the Republicans as it is today, the winner of November’s contest will rely heavily on unilateral action taken via executive orders and rulemakings through the federal government via the department and agencies that have significant power. Enacting larger policy proposals requires approval by Congress and the winner of the election will have a much tougher time enacting that part of their agenda. Exhibit 1 shows the numbers needed to win each race.
The electoral college
The presidential candidate that wins the most number of votes (or wins “the popular vote”) does not automatically become president. Instead, the US employs an electoral college system. Votes are tallied at a state level, and the winner in each state earns the “electoral votes” that belong to that state (with the number of electoral votes in each state determined by population size). A candidate needs to win at least 270 of the 538 electoral votes in order to win the presidency.
The Senate
US senators serve six-year terms, which means that roughly a third of the 100 Senate seats are up for grabs at each federal or mid-term election. Currently the Republicans control the Senate. There are 35 seats up for election this year – 23 currently held by Republicans and 12 currently held by Democrats. To win control of the Senate, the Democrats would need to keep all of their existing seats and flip three seats if they win the presidency, or four if they do not, as the vice president casts tie-breaking votes.
The House of Representatives
Each of the 435 seats in the House are up for election in November, with the winners serving a two-year term. Currently the Democrats control the House. For the Republicans to win back control, they would need to win 21 additional seats and hold on to two vacant seats that were previously held by Republicans.
Members of both the House and the Senate serve on a wide range of committees. The Senate has the authority to approve presidential nominations – such as Supreme Court justices and members of the Federal Reserve Board. Betting odds at the start of July put a Democratic sweep of the House and the Senate as the most likely by a significant margin.
Exhibit 1: Votes or seats in the Electoral College, the Senate and the House of Representatives
Source: 270 to Win, The Cook Political Report, J.P. Morgan Asset Management. *In 2016 Trump earned 306 pledged electors, Clinton 232. They lost, respectively, two and five votes to faithless electors in the official tally. **51 seats are needed for a simple majority if the dominant party in the Senate is not represented in the White House. If the president and majority party are the same, only 50 seats are needed for a majority because the vice president casts the tie-breaking vote. 2016 numbers include two independents that vote with the Democrats. Data as of 30 June 2020.
How might Covid-19 change the election timeline?
While Covid-19 has upended the usual schedule, election day itself is unlikely to shift given the need for Congress to approve any change.
The coronavirus outbreak has already had a significant impact on the primary season – the process by which Democratic and Republican presidential candidates are formally nominated. After state lockdowns began in earnest in mid-March, 16 states and one territory either postponed, cancelled or switched their primaries to vote-by-mail with extended deadlines. The Democratic National Convention, at which the Democratic candidate is officially nominated to represent the party in the presidential election, has been delayed by a month to 17-20 August, a week before the Republican National Convention.
While election day may well look very different to any other seen before in the US, the 3 November date is not likely to move. Presidential elections are set in federal law to take place on the Tuesday after the first Monday in November, and for this to be changed, approval from the Democrat-controlled House of Representatives would be required.
It appears that social distancing is highly likely to be required in some form and may threaten voter turnout, which is particularly important for the Democrats’ prospects given the distribution of the electoral college. Non-traditional voting methods have been rising in availability and popularity in recent years (see Exhibit 3), but Democratic proposals for further expansions in 2020 have so far been met with strong opposition by the Republicans.
Exhibit 3: States permitting different methods of alternative voting
Number of states
What are the investment implications?
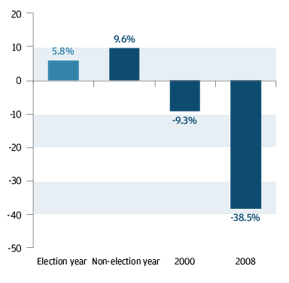
Election years are on average characterised by lower returns and higher volatility, but market dynamics in 2020 will be dominated by the prevailing economic environment
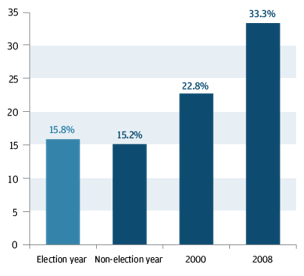
Typically, returns are lower and volatility is higher in election years than in non-election years (see Exhibit 6), although these averages are significantly skewed by major recessions and market events in recent election years. Returns and volatility in 2020 will almost certainly be attributable to Covid-19, not the political campaigns quietly existing alongside it. While the election is still a few months away, there are three areas of focus that could materially impact investor sentiment over the summer.
1. Roadmap for the rebound Top priority for whoever leads the next US administration will be to manage the economy as it restarts in earnest in 2021. Government finances have been stretched by the vast fiscal packages approved so far and tough choices will need to be made about whether to push ahead with further stimulus, or to try to tighten the belt as the recovery gets underway. The Federal Reserve (the Fed) may come under increasing pressure to keep yields low, although if this pressure is so strong as to cause investors to question the Fed’s independence, there is a risk that longer-dated yields could be pushed higher.
2. US-China relations The US-China relationship is now back on a worrying path. The hit to both business confidence and investment intentions across the globe in 2019 highlighted the economic damage that was caused by the trade war. Actions from either country that ratchet up tensions further ahead of the November election are a clear catalyst for market volatility. While so far it has been a Republican administration in charge of the negotiations, further information from the Democrats about how they would propose to manage this relationship may also impact market sentiment.
3. Progressive policy proposals The most progressive policies moved out of the picture as the most progressive Democratic candidates exited the race. Yet it is still evident that Joe Biden’s vision for corporate America is clearly different to President Trump’s. Democratic proposals for the use of anti-trust legislation to clamp down on “Big Tech”, plans for corporate tax changes and how to shore up the healthcare system are all matters that warrant close attention.
The combination of policies employed by the next administration will be an important factor in determining whether the US stock market’s leadership over much of the past decade will continue. An environment of escalating trade tensions has favoured the higher-quality US stock market relative to other regions historically, although we recognise that an increase in regulatory pressure on the tech titans could pose risks to US market leadership given the high weights to technology and communication services sectors in US indices. We will be tracking developments closely as 3 November approaches.
Exhibit 6: S&P 500 price returns Percent, average return from 1932 – 2019
S&P 500 realised volatility Percent, 52-week standard deviation of price returns, 1932-2019
As the US is one of the largest most influential markets globally, what happens next from a political point of view is important to the global economy.
Please keep checking back for regular updates and blog posts.