Brewin Dolphin with further comment written yesterday (25/03/2020) and received later in the day. It’s good to read a variety of views so that you can get a better understanding of the current situation.
The UK has now entered full lockdown mode, joining our European neighbours and a growing host of other nationalities, including 1.3bn Indians, confined to their homes in order to stem the merciless march of COVID-19. It is hoped that by introducing these strict rules now, the UK may be spared some of the tragic scenes which have befallen the likes of Spain and Italy where health services are creaking under the strain and the death tolls continue to rise.
In the US, markets have been buoyed by the Fed’s latest announcement whereby they have committed to “unlimited” bond-buying and have expanded their mandate to corporate and municipal bonds that analysts estimate will deliver $4 trillion-plus in loans to non-financial firms. Basically, this is a commitment that the Fed are willing to do whatever it takes to sustain the US economy and support business through the turmoil. Following a weekend of fractious negotiations in Congress, Treasury Secretary, Steven Mnuchin, has finally confirmed that that a deal to unleash a $2 trillion U.S. stimulus has been struck, adding further ballast to weather the storm.
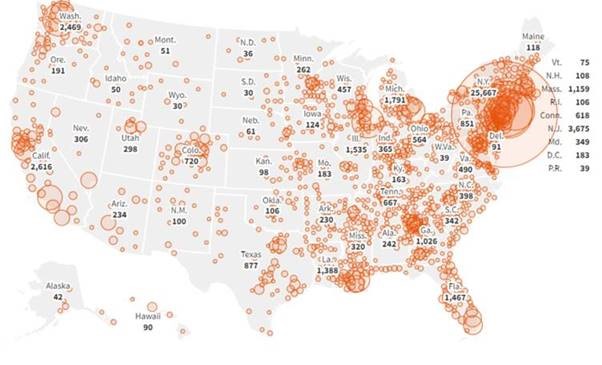
Despite intimations by Trump that US citizens could be back out working by Easter, New York Governor, Andrew Cuomo, has warned that the spread in New York will soon overwhelm health services without significant Federal aid as cases top 25,000 in the state alone. The map by Thomson Reuters below illustrates how the virus has infiltrated all areas of the US but it is most concentrated on the east coast.
Finding the Bottom
In markets, investors are grappling with the new environment, trying to establish if we have reached “the bottom”. One key metric which we pay close attention to in this regard is volatility. Historically, when the volatility index (VIX) – aka the fear index – peaks this can often suggest a suitable entry point. Below is a chart showing the performance of US equities (S&P 500) year to date and the VIX peaking on 16th March (on an inverted scale).
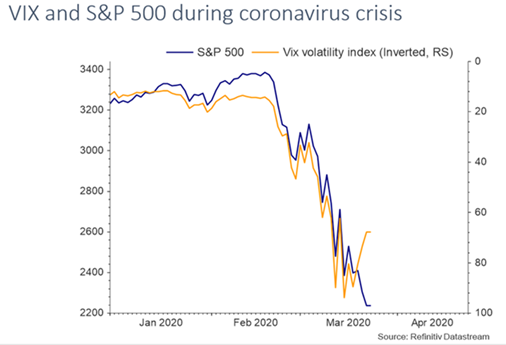
However, in previous crises there has often been a lag between the VIX peak and the US market trough. The table below shows the number of calendar days that it took before the S&P bottomed after the VIX peaked in four previous crises – the average has been 72. The last column shows the average decline in the S&P 500 from the date the VIX peaked – the average has been 4%.
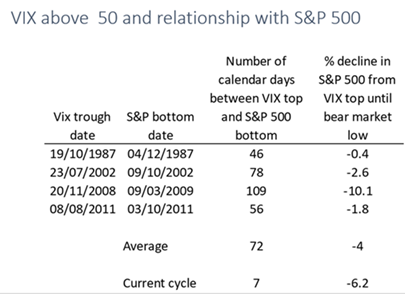
This time round, the S&P has fallen -6.2% since the VIX peak last week (before rising on more positive US stimulus news) which suggests we could be approaching the seabed as we plumb these uncharted depths, however it is still too early to tell and there could still be choppy waters ahead!
Markets in a Minute
- ITV became the latest company to cancel their dividend and suspend guidance.
- JD Sports announced all US , European and UK stores are now closed.
- Mike Ashley had a PR nightmare when he claimed Sports Direct and Evans Cycles would remain open as essential businesses before u-turning following public backlash.
My advice remains the same, stay invested and ride out the volatility. It could still be pretty rough, and we may see further drops in value before markets recover. Remaining invested is the only way you can benefit fully from the recovery.
We will keep posting blogs to give you a wide variety of input from different Fund Managers and providers. Hopefully the consistency of the input will help you at this time.
Steve Speed
26/03/2020