Please find below, an update on market performance, received from Invesco yesterday.
A number of competing macroeconomic factors have been at play in recent months that have impacted financial markets. While vaccination rates continued to rise, the spread of the Delta variant has seen a large increase in new Covid cases, which saw further containment measures, notably in “zero-tolerance” countries, such as China. Despite that there was a general trend towards a further re-opening of economies and a return to normality. However, PMIs have been weakening as the pace of the recovery slows. Talk of a period of stagflation has increased, with inflation having risen sharply as base effects, supply chain issues and labour shortages have all impacted. While most Central Bankers and economists see the inflation risk as transitory, the underlying trend in monetary policy is for the removal of some of the extraordinary support that has been put in place over the past 18 months, led by tapering and ending of asset purchase programmes and rate hikes in due course. Concerns around US fiscal policy and the debt ceiling were increasingly in focus towards the end of the quarter. In China regulatory pressures and the fate of Evergrande, the second largest property developer, also weighed on investor market sentiment. Against this backdrop it was hardly surprising that financial markets have generally found it much tougher going as we approach autumn.
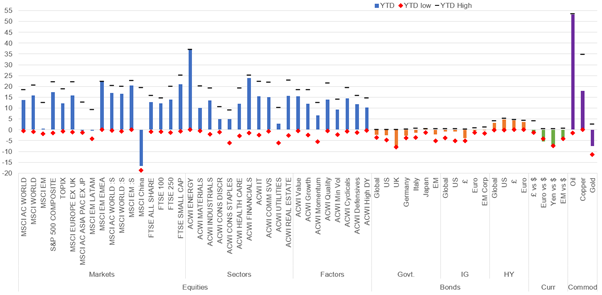
Not even a strong rally on Wall Street on Friday was enough to prevent global equities from having their worst week (MSCI ACWI -2.2%) since February. With China ending the week with small gains (MSCI China 0.4%) this limited EM losses (-1.1%) and ensured outperformance relative to DM (-2.3%). EM EMEA continued to benefit from rising Energy prices, rising 1.1% and leaving it up 22% YTD. Within DM weakness was across the board with Japan (-4.3%) and Europe ex UK (-2.6%) seeing the worst of the major market declines. Small Caps (-1.5%) outperformed slightly with DM and EM performing in-line. At a sector level performance was again dominated by Energy (4.6%) and it is now up 37.1% YTD, leaving it just over 13% ahead of the next best sector, Financials, which also had a good relative performance week (-0.1%). Underperformers were led by IT (-4.1%) and Health Care (-3.2%). Sector mix ensured that Value had a very strong week relative to Growth, falling just -0.9% compared to -3.4%. Rising yields have hurt long-duration assets. Quality (-3.4%) also had a tough week. UK equities had another strong relative week with the All Share down just -0.8% on the back of large cap outperformance (FTSE 100 -0.3%), as mid (FTSE 250 -2.7%) and small caps (FTSE Sm Caps -2%) struggled. Performance was boosted by a very strong Energy sector (6.9%), while Basic Materials (0.1%) also eked out a small gain. Industrials (-3.7%) and Utilities (-2.4%) were the main laggards.
Government bond yields were generally biased higher, albeit the moves in the UST and EZ bonds were marginal. The largest DM rise was in Gilts where the 10yr rose 8bp to close at 1%, its first time at that level since May 2019. It is now up 81bp since the start of the year. A further -1.5% for the Gilt index during the week left it down -7.6% YTD. Weak Gilts spread into £ IG with yields rising 10bp and the YTM above 2% for the first time since mid-2020. Yields rose less in US and Euro IG, with commensurate better relative performance. In HY, yields also rose 10-11bp across the board, but shorter duration meant that the sector outperformed IG, albeit still suffered small losses.
The US$ hit a one-year high during the week ending with the US Dollar Index seeing a gain of 0.8%, leaving it up 3.6% YTD. Both £ and the Euro lost 1%, with both close to their YTD lows. EM currencies also weakened with the JPM Emerging Market Currency Index down -0.5%, leaving it -4% YTD.
In commodities the Bloomberg Commodity Spot Index gained 2% and is now up 28.8% YTD. Energy (4.8%) and Softs (4%) led the gains again. While Oil prices saw a modest gain (1.5%) Natural Gas continued its sharp rise higher with an 8% gain. Industrial Metals struggled with Copper falling -2.2% and at 17.9% YTD is well below its 34.8% high. A contraction in the Chinese Manufacturing PMI for the first time in 19 months and a stronger US$ weighed. Gold eked out a small positive return (0.2%) its first in four weeks but is still down -7.5% YTD. Silver’s woes, however, have been far greater. It is down -14.6%.
Market performance last week (%)

Past performance is not a guide to future returns. Sources: Datastream as at 3 October 2021. See important information for details of the indices used.1
YTD market performance (%)
Past performance is not a guide to future returns. Sources: Datastream as at 3 October 2021. See important information for details of the indices used.1
Chart of the week: ICE UK Natural Gas NBP Futures (US$/MMBtu)
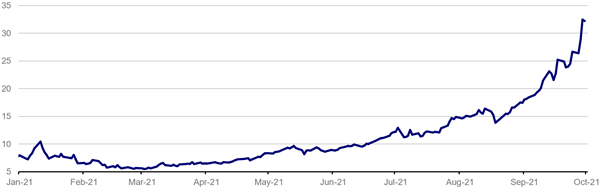
Past performance is not a guide to future returns. Source: Datastream as at 2 October 2021.
- There have been some spectacular moves in commodity prices this year and none more so than what has happened to natural gas prices, particularly in the UK and Europe. In the UK the ICE future for the current month has risen 490% YTD and 84% since the start of September.
- This substantial jump matters for UK consumers and businesses given its importance as a source of power. EDF estimate that 78% of buildings are heated with gas. In the US by comparison it is just 50%. In terms of electricity generation, in 2020 35% came from gas, ahead of wind at 24% and nuclear at 14%. The impact on consumers is clear for all to see in Ofgem’s 12% and 13% hike to the energy price caps for default tariffs and pre-payment customers respectively, that took effect from last Friday. A further, potentially substantial, rise is likely when Ofgem reviews the cap again in February. Clearly this will have consequences for inflation with gas and electricity prices making up 3% of the CPI Basket. Deutsche Bank estimate that it could add 50-60bp to headline CPI. And household spending and industrial activity could also be impacted (fertiliser production being a recent example), so yet another headwind for an economy that is already showing signs of slowing.
- Why have prices risen so much? A smorgasbord of factors have been at play. After a cold winter and spring, supplies have not been replenished as much as expected. The UK has the added problem compared to many other major European economies of having very little storage capacity, just 2% of its annual demand. Consequently, the country relies more on pipeline and LNG imports, with the UK importing more than half its gas (75% from Norway and Qatar). With competition for LNG supplies high due to elevated levels of demand in Asia, alongside restrictions to US LNG supply and the overall lack of LNG terminals and shipping, it is hardly a surprise that prices have surged. Pipeline flows from Norway, the biggest source of gas imports (55% of total in 2020), have also been under pressure due to higher levels of gas field maintenance this year and increased domestic demand due to water shortages for hydro. Nature hasn’t been helpful in the UK either with a lack of wind limiting the use of wind power.
- How long will this surge in prices last? Some of the factors should be transitory; the wind will blow soon (!) and some shorter-term supply issues are likely to be resolved. However, key further out will be how long the surge in Asian demand continues and what sort of winter we experience. And while inventories remain depleted, prices could well remain elevated until well into next year. That’s certainly what futures are telling us in the UK with prices not dropping from current levels until the spring and then remaining well above pre-pandemic levels thereafter. This has obvious negative consequences for the growth/inflation outlook.
Key economic data in the week ahead
- Employment data from the US will be the most scrutinised release of the week as the Fed has said the recovery in the labour market is key to its path towards tightening policy. Progress in Washington on the fiscal front and around the debt ceiling will be closely monitored. OPEC+ meets on Monday to review its output policy against the backdrop of an oil price that has recently risen above $80bbl for the first time since 2018.
- In the US September’s ISM Service Index is released on Tuesday and although expected to remain strong at 59.9 this would be lower than August’s reading of 61.7. Before Non-Farm Payrolls, the ADP Employment Change published on Wednesday is estimated to show a 430k increase, higher than August’s 374k and the YTD average of 418k. Initial Jobless Claims unexpectedly rose for the third week in a row last week to 362k. Thursday’s reading is estimated to see a small decline to 350k. Friday’s September Non-Farm Payrolls are forecast to add 470k new jobs, an improvement on last month’s disappointing 235k. The unemployment rate is forecast to fall to 5.1% from 5.2% in August.
- Although there will be no significant economic data released from the UK this week, the Chancellor of the Exchequer will speak at the Conservative Party conference on Monday and is expected to announce a package of grants to help households facing a cost-of-living crunch.
- Retail sales in the EZ on Wednesday are forecast to have increased 0.9%mom in August following the 2.3%mom fall in July. This would leave it up 0.4%yoy, which would be the lowest rate of growth since March when the continent was emerging from stringent lockdown measures.
- It is the Golden Week holiday in China. The Caixin Services Index for September is expected on Friday to show the sector still in contraction but improving to 49.2 from 46.7 in August.
Nothing of note from Japan this week.
Please continue to check our Blog content for advice and planning issues and the latest investment, markets and economic updates from leading investment houses.
David Purcell
5th October 2021